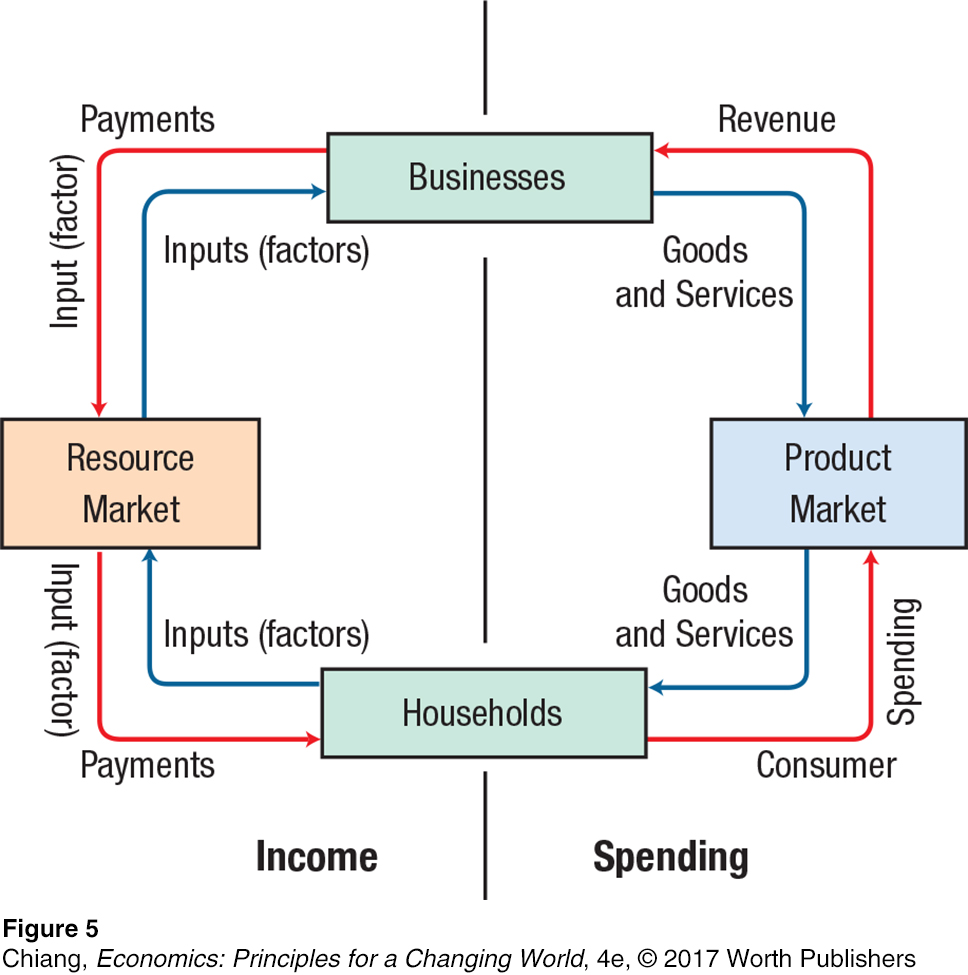
FIGURE 5 A SIMPLE CIRCULAR FLOW DIAGRAM
 This circular flow diagram illustrates why the economic aggregates in our economy can be determined in either of two ways. Spending flows through the right side of the diagram, while the left side of the diagram shows incomes flowing to households. Note that one person’s spending is another person’s income.
