FIGURE 12 COST-PUSH INFLATION IN THE 1970S
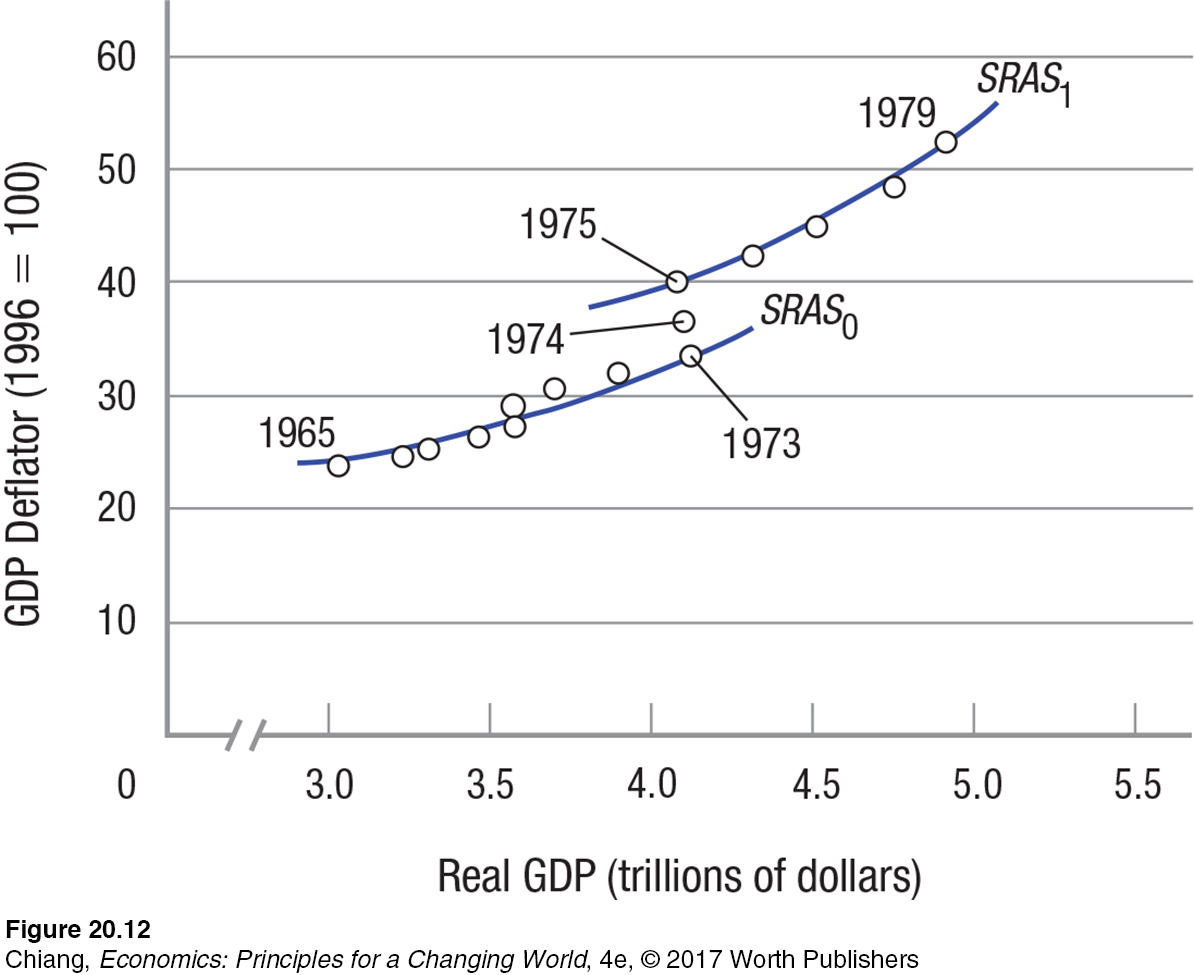 The rise in equilibrium prices following the 1973 oil shocks was striking. From 1973 to 1975, prices rose, yet output stood still as the economy adjusted to the new energy prices. Superimposed over the actual annual data are two hypothetical short-run aggregate supply curves. Notice that it took the economy roughly three years to absorb the oil shock.