FIGURE 3 THE PHILLIPS CURVE—1960S
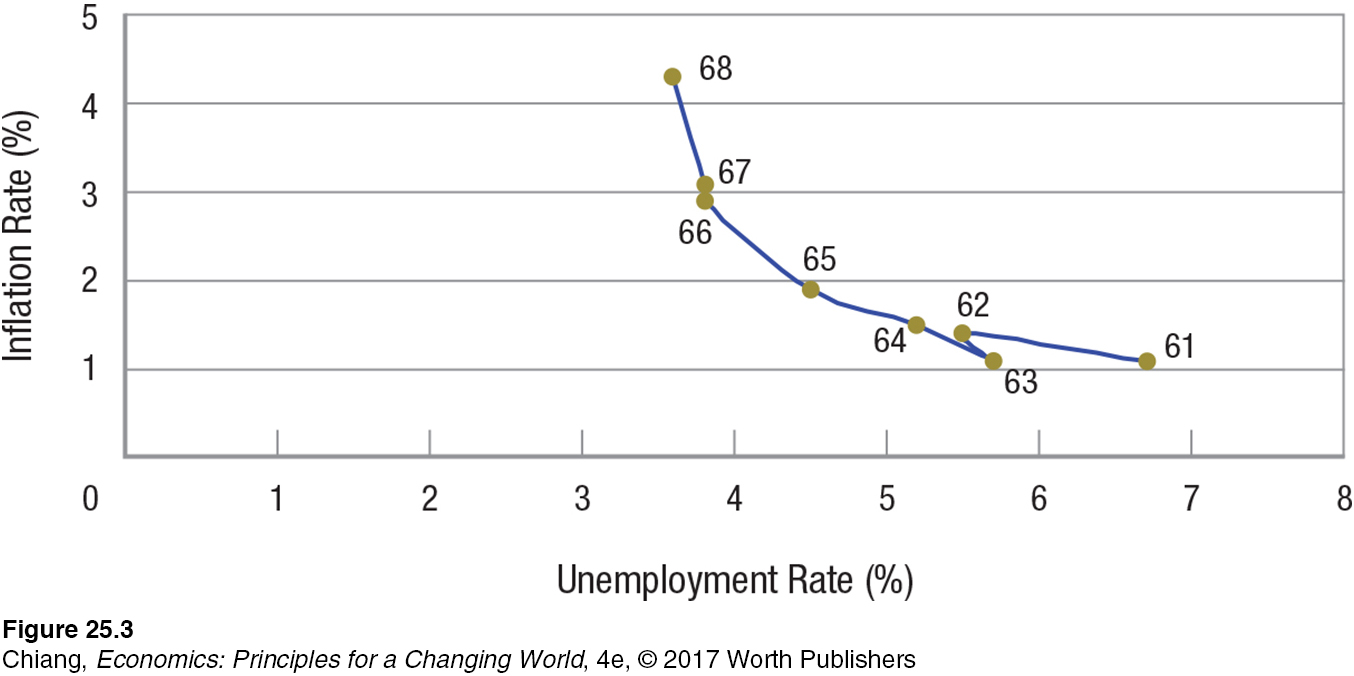 The Phillips curve for the United States during the 1960s gives a negative relationship between inflation and unemployment, much like that found in the last two figures. Using this relationship, policymakers concluded that an inflation rate of 3% to 4% was required to keep unemployment below 4%.