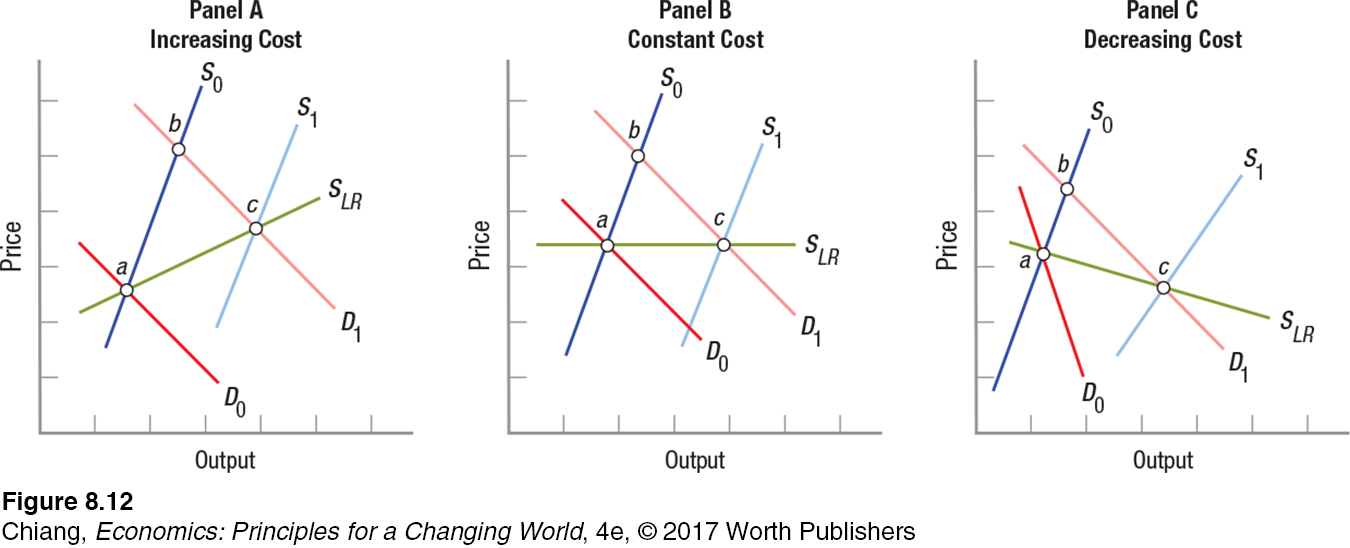
FIGURE 12 LONG-RUN INDUSTRY SUPPLY CURVES
 Panel A shows an increasing cost industry. Demand and supply are initially D0 and S0, with equilibrium at point a. When demand increases, price and output rise in the short run to point b. As new firms enter the industry, they drive up the cost of resources. Supply increases in the long run to S1 and the new equilibrium point c reflects these higher resource costs. In constant cost industries (panel B), firms can expand in the long run without economies or diseconomies; therefore, costs remain constant in the long run. In decreasing cost industries (panel C), expansion leads to external economies and thus to a long-run equilibrium at point c, with lower prices and a higher output than before.

