OLIGOPOLY
oligopoly A market with just a few firms dominating the industry, where (1) each firm recognizes that it must consider its competitors’ reactions when making its own decisions (mutual interdependence), and (2) there are significant barriers to entry into the market.
Oligopoly markets are those in which a large market share is controlled by just a few firms. What constitutes a few firms controlling a large market share is not rigidly defined. Further, these firms can sell either a homogeneous product (e.g., gasoline, sugar) or a differentiated product (e.g., automobiles, pharmaceuticals).
Industries can be composed of a dominant firm with a few smaller firms making up the rest of the industry (e.g., computer operating systems), or the industry can be composed of a few similarly sized firms (e.g., automobiles, tobacco). The point of this discussion is that oligopoly models are numerous and varied, and we will explore only a few. Oligopoly models do, however, have several common characteristics.
Defining Oligopoly
All oligopoly models share several common assumptions:
There are only a few large firms in the industry.
mutual interdependence When only a few firms constitute an industry, each firm must consider the reactions of its competitors to its decisions.
Each firm recognizes that it must take into account the behavior of its competitors when it makes decisions. Economists refer to this as mutual interdependence.
There are significant barriers to entry into the market.
Because there are only a few firms, each firm possesses substantial market power. However, because the products sold by oligopolists are similar to each other, the actions of one will affect the ability of the others to sell or price their output successfully. If one firm changes the specifications of its product or increases its advertising budget, this will have an impact on its rivals, and they can be expected to respond in kind. Thus, one firm cannot forecast its change in sales for a new promotion without first making some assumptions about the reaction of its rivals.
In an industry composed of just a few firms, entry scale is often huge. Plus, with just a few firms, typically brand preferences are quite strong on the part of consumers, and a new firm may need a substantial marketing program just to get a foot in the door.
Cartels: Joint Profit Maximization and the Instability of Oligopolies
Cartels are theft—
GRAEME SAMUEL, HEAD OF AUSTRALIA’S ANTITRUST OFFICE
cartel An agreement between firms (or countries) in an industry to formally collude on price and output, then agree on the distribution of production.
The first oligopoly model we examine is collusive joint profit maximization, or a cartel model. Here, we assume that a few firms collude (combine secretly) to operate like a monopoly, using maximum market power to set the monopoly price and output and share the monopoly profits. Cartels are illegal in the United States and in the European Union, although international laws do not ban them.
Cartels are not as common today as they were two or three decades ago. The most famous cartel is OPEC, the Organization of Petroleum Exporting Countries, which consists of twelve countries that set production quotas in order to limit overall oil production to drive up prices. Although OPEC was powerful from the 1970s up until the last decade, today, competition from non-
Figure 4 illustrates a hypothetical cartel consisting of five firms. By forming a cartel, these five firms agree to fix their overall output equal to the profit-
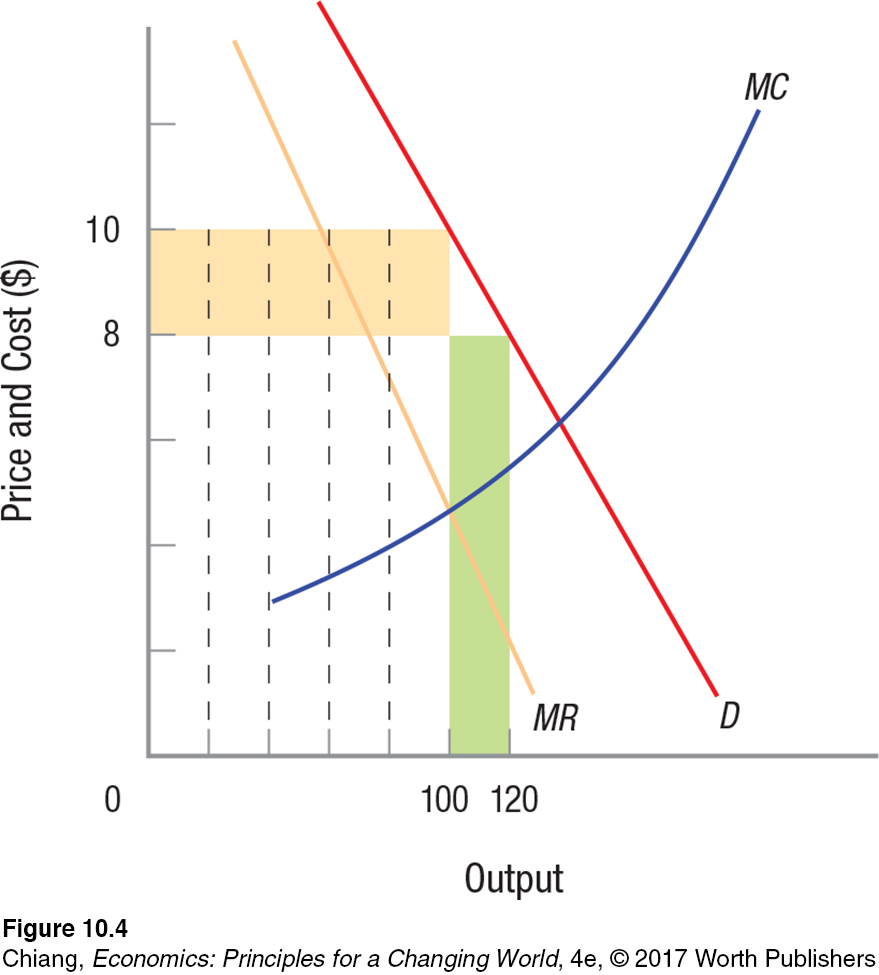
However, cartels are inherently unstable because of the incentive to cheat by individual members. Although the cartel as a whole is maximizing profits, each individual member can potentially earn more profits by producing more than its output quota. As illustrated in Figure 4, if one firm exceeds its quota by doubling output from 20 to 40, the overall output of the cartel increases from 100 to 120 units. By expanding production, the market price falls from $10 to $8, causing revenues to fall by $200 ($2 × 100 units), shown as the yellow area. This reduction in revenues is shared by all five firms, with each firm losing $40 (or one share of the yellow area). Despite this loss, the cheating firm benefits because the extra 20 units it produces earn the firm $160 in additional revenue ($8 × 20 units), shown as the green area. The marginal revenue from cheating is therefore $160 − $40 = $120. As long as the marginal cost of producing the extra 20 units is less than $120, the firm benefits from cheating on the cartel agreement.
However, when one firm cheats, this often leads to other firms cheating. As more and more cartel members cheat, the price continues to fall toward the competitive price, greatly hurting the noncheating members. The instability of cartels is enhanced when a member can increase its output relatively undetected, and when the cost of production is low, making cheating more profitable. Over time, the cartel falls apart when all members increase their output, resulting in a competitive outcome. Therefore, market power in a cartel can range from the monopoly case (if all members adhere to their quotas) to the competitive case when cartels completely break down.
Although cartels are inherently unstable, certain factors can enhance the likelihood of the cartel’s survival. First, cartel stability is enhanced with fewer members with similar goals. With fewer members, any action that breaches the cartel agreement is more easily noticed and punishable. Second, stability is improved if the cartel is maintained with legal provisions (such as government protection). Third, stability is improved if firms are unable to differentiate their products (such as providing enhanced service or some other product as an inducement to purchase). Fourth, stability is improved when each firm’s cost structure is similar, thereby not giving any firm a cost advantage over another. Finally, a cartel is more stable when there are significant barriers to entry preventing new firms from competing against existing cartel members.
These factors do not bode well for the future of the twelve member countries of OPEC. Although OPEC members produce a uniform product (crude oil) and have similar cost structures, enforcement of the quotas has at times been shaky with politically unstable countries. Further, OPEC’s total share of world oil production has been surpassed by non-
The Kinked Demand Curve Model and the Stability of Oligopolies
Oligopoly industries share a characteristic that prices tend to be stable for extended periods of time. For example, prices for wireless data plans are similar across all major wireless providers and rarely fluctuate. Why do these prices tend to stay the same when the underlying costs of providing the services change?
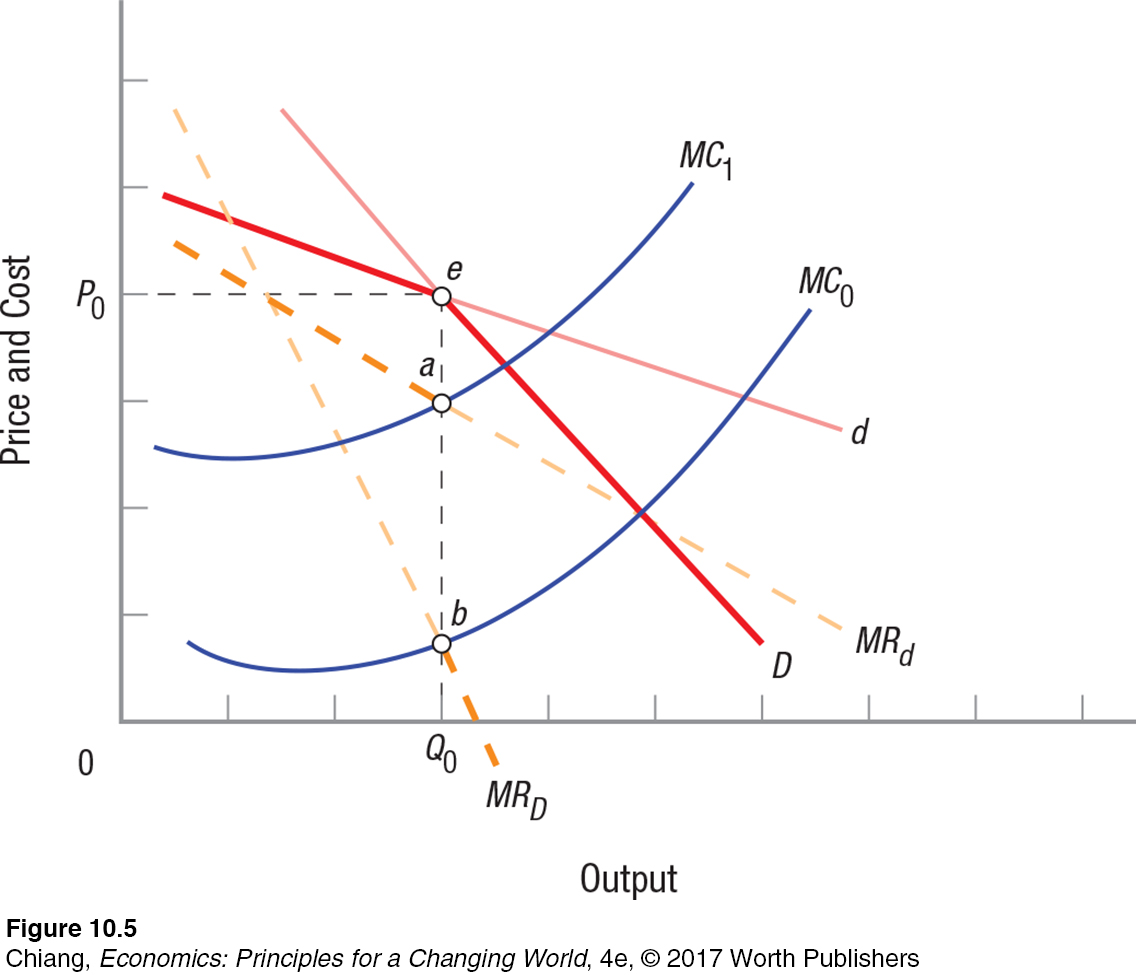
Figure 5 provides an explanation for the price stability in oligopoly industries by showing two demand curves. Demand curve d is relatively elastic, and represents demand for one firm when competing firms choose not to follow its price changes. Therefore, any change in price is generally met with significant changes in quantity demanded. On the other hand, demand curve D is relatively inelastic, and represents the demand for one firm when competing firms do match price changes. As a result, any change in price will not lead to much change in quantity demanded.
kinked demand curve An oligopoly model that assumes that if a firm raises its price, competitors will not raise theirs. However, if the firm lowers its price, its competitors will lower their price to match the reduction. This leads to a kink in the demand curve and relatively stable market prices.
The kinked demand curve model assumes the following:
If a firm raises the price for its product, its competitors will not react in hopes of capturing more market share.
If a firm lowers its price, its competitors will react with lower prices of their own to avoid losing market share.
As a result, the relevant demand curve facing the firm is the darkened portion of demand curves d and D that is kinked at point e. The relevant portion of the marginal revenue curve is the darkened dashed curve MR with the discontinuity between points a and b. Notice, we are just using the relevant portions of MRd and MRD. The graph shows MC1 and MC0 intersecting the MR curve at points a and b, respectively. However, the equilibrium price and output remain at P0 and Q0. In fact, any marginal cost curve located between MC1 and MC0 will result in the same equilibrium price and output.
The analysis of unstable and stable oligopoly models underscores the importance of the mutual interdependence of firms. How one firm reacts to a competitor’s market strategy determines the nature of competition in the industry. These ideas led to game theory, which we consider in the next section.
CHECKPOINT
OLIGOPOLY
Oligopolies are markets (a) with only a few firms, (b) where each firm takes into account the reaction of rivals to its policies, and (c) where there are significant barriers to entry.
The market power for an oligopoly can be substantial, although the ability of a firm to utilize its market power fully depends on its interdependence with competing firms.
Cartels result when several firms collude to set market price and output. Cartels typically use their market power to act like monopolists and share the economic profits that result.
Cartels are inherently unstable because individual firms can earn higher profits by selling more than their allotted quota. As more firms in the cartel cheat, prices fall, defeating the agreement.
The observation that prices are stable in oligopoly industries (other than in cartels) gave rise to the kinked demand curve model. The model assumes that competitors will follow price reductions but not price increases. This leads to a discontinuity in MR, permitting cost to vary substantially before prices are changed.
QUESTION: The major drug cartels operating along the U.S.–Mexico border have become increasingly violent in recent years as cartels try to protect their trafficking routes to the U.S. market from competitors. But in addition to conflicts with external competition, cartel members have been murdered for exceeding their distribution quotas. Given the nature of how cartels function, explain why cartel leaders have become increasingly violent as a result of these events.
Answers to the Checkpoint questions can be found at the end of this chapter.
A cartel functions best when its members adhere to the established quotas (which keep prices for drugs high) and also when no external competition exists (allowing the cartel to operate as if it were a monopoly). Competition from noncartel drug traffickers as well as cartel members exceeding their production quotas poses a threat to the cartel’s existence, and hence cartels will often use violence to prevent those activities from occurring. When the drug trade is dominated by several large and powerful organizations, the actions of one organization have a significant effect on the others, an example of the mutual interdependence of firms in an oligopoly.