ENVIRONMENTAL POLICY
We have seen that market failure can lead to excessive amounts of products that pollute or generate other negative externalities, or to overuse of commonly owned resources that result in environmental degradation. This section puts these market failures together by looking at environmental policy.
government failure The result when the incentives of politicians and government bureaucrats do not align with the public interest.
Market failure is one reason why unregulated markets may produce inequitable or inefficient results. Government policies, however, do not always make things better. Government failure occurs when (1) public policies do not bring about an optimal allocation of resources, and/or (2) the incentives of politicians and government bureaucrats are not in line with the public interest.
Government failure may result from the practical inability of policymakers to gather enough information to set good policies. Water pollution, for instance, is well understood, resulting in fairly obvious regulatory policies, but the same is not true for issues such as global climate change. Even if we all agree that the Earth is getting warmer and humans are partly to blame, controversy remains about the adequacy of public policy to address this problem.
Despite the challenges of creating and implementing environmental policy, it is still an issue that must be tackled. We now discuss various questions that arise when setting goals for environmental policy and the many choices that are available to policymakers.
Intergenerational Questions
Should politicians consider the interests of voters who haven’t yet been born? Environmental issues raise complex questions involving how resources are to be allocated across generations. Some resources, such as sunlight, are continual and renewable. Others, such as forests, fisheries, and the soil, are renewable but exhaustible if overexploited. And some resources are nonrenewable, such as oil and coal. These resources are finite and cannot be renewed, but their available stock can be expanded through exploration or the use of new technologies that allow greater extraction or more efficient use.
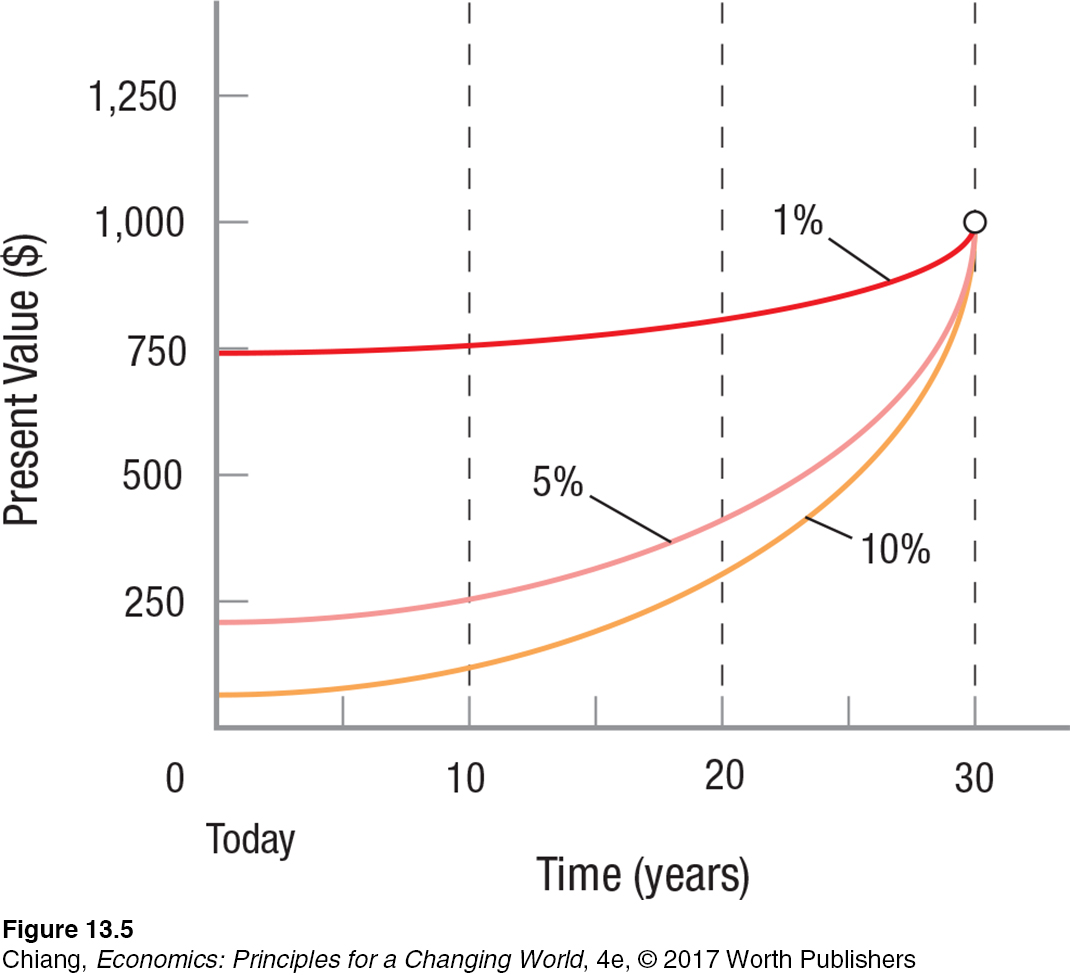
When we develop environmental policies, we need to consider and evaluate different possible futures. Figure 5 is a reminder of the effects that discount rates have on the present value of a fixed payment that will come due at some date in the future. For environmental policies, the discount rate we choose is crucially important.

A higher discount rate means that the value today of a future payment will be less. At a 10% discount, a payment of $1,000 in 30 years is worth only $42 today, whereas discounting the same $1,000 at 1% yields a present value of $748. The higher the discount rate we choose, the lower the value we place on the environmental damage to be suffered by future generations. The lower our discount rate, conversely, the more we are willing to protect the health of the future environment. As always, crafting good public policies requires striking a balance between the two.
Socially Efficient Levels of Pollution
We have already seen that some pollution is acceptable to society. To require that no one pollute, period, would bring most economic activity as we know it to a halt. Yet, pollution damages our environment. The harmful effects of pollution range from direct threats to our health coming from air and water pollution to reductions in species from deforestation.
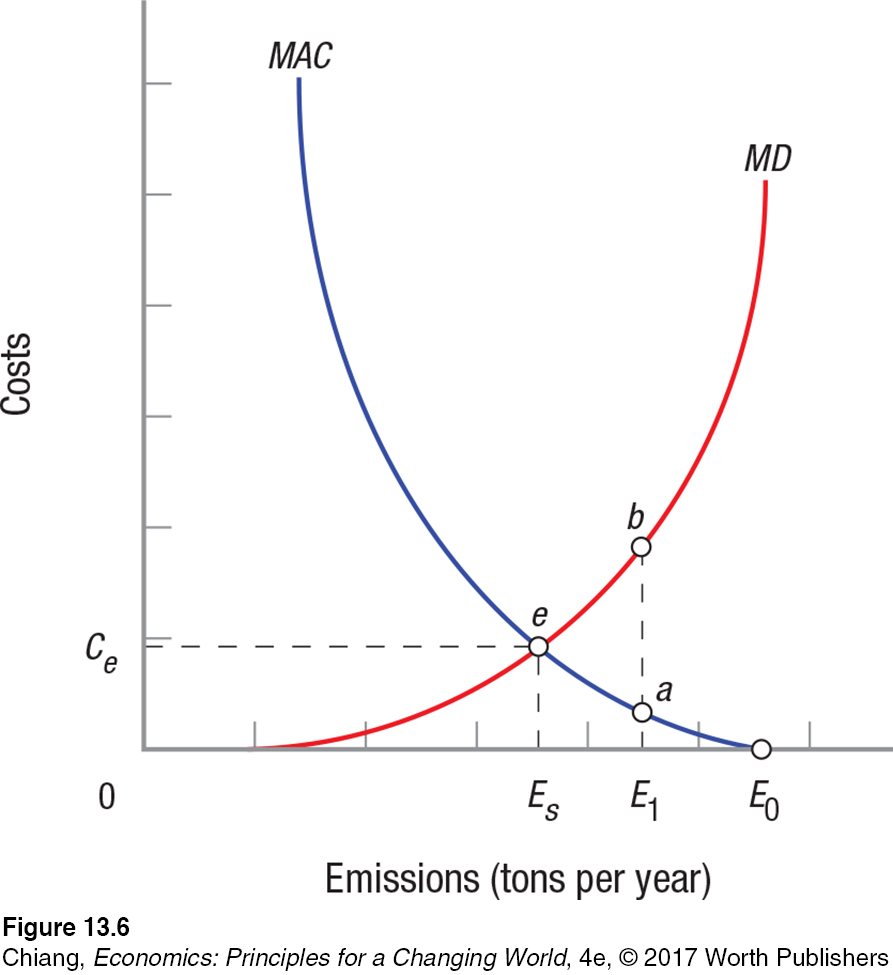
The damages that come from pollution are a cost we incur for living. To be alive is to generate some pollution. Our focus is on marginal damage, which resembles the marginal cost curves we studied earlier. The marginal damage (MD) curve in Figure 6 shows the change in damages that comes from a given change in emission levels. Notice that as emissions levels rise, the added damages rise.

The horizontal axis of Figure 6 measures the tons of pollution emitted into the environment (tons per year). Note that E0 represents the maximum pollution (no environmental cleanup at all). The vertical axis measures the environmental costs in dollars. These costs represent a dollar value for various environmental losses, including the physical costs of pollution (asthma attacks and other lung diseases), the aesthetic losses (visual impact of clear-
Abatement costs are the costs associated with reducing emissions. A utility plant dumping effluent into a river can treat the effluent before discharge, but this costs money. In Figure 6, marginal abatement costs (MAC) begin at zero at E0, then rise as emission levels are reduced (moving leftward from E0). The MAC curve in Figure 6 is a generalized abatement cost function, but in practice, the costs vary for different sources of pollution and the technologies available for reducing them. Chemical plants face different problems than utilities that release hot water into rivers. Cooling the water before release clearly requires a different technology—
The socially optimal level of pollution in Figure 6 is ES, at a cost to society of Ce (point e). To see why this is so, assume that we are at pollution level E1. The cost to reduce another unit of emissions is found at point a (measuring on the vertical axis), while the damage that would result from this pollution is found at point b. Since b > a, society is better off if emissions are reduced. Once we begin reducing emissions below ES, however, abatement costs overtake marginal damages, or the costs of cleanup begin to outweigh the benefits.
The total damage from pollution in Figure 6 is represented by the area beneath the marginal damages curve and to the left of ES. Total abatement costs, meanwhile, are equal to the area beneath the marginal abatement costs curve and to the right of ES. Combined, these two costs represent the total social costs from emissions. We turn now to consider how environmental policy can ensure that emissions approach this optimal level.
Overview of Environmental Policies
Over the years, many types of environmental policies have been developed in response to different problems, covering the spectrum from centralized control to decentralized economic incentives. To be effective, all environmental policies must be efficient, fair, and enforceable, and they must provide incentives for improvement in the environment.
command and control policies Environmental policies that set standards and issue regulations, which are then enforced by the legal and regulatory system.
As a general rule, the more centralized an environmental policy, the more likely it represents a command and control philosophy. This means that a centralized agency sets the rules for emissions, including levels of effluents allowed, usable technologies, and enforcement procedures. Command and control policies usually set standards of conduct that are enforced by the legal and regulatory system. Abatement costs at this point become compliance costs of meeting the standards. Standards are popular because they are simple, they treat all firms in an industry the same way, and they prevent competing firms from polluting.
market-
At the other end of the spectrum are market-
Command and Control Policies
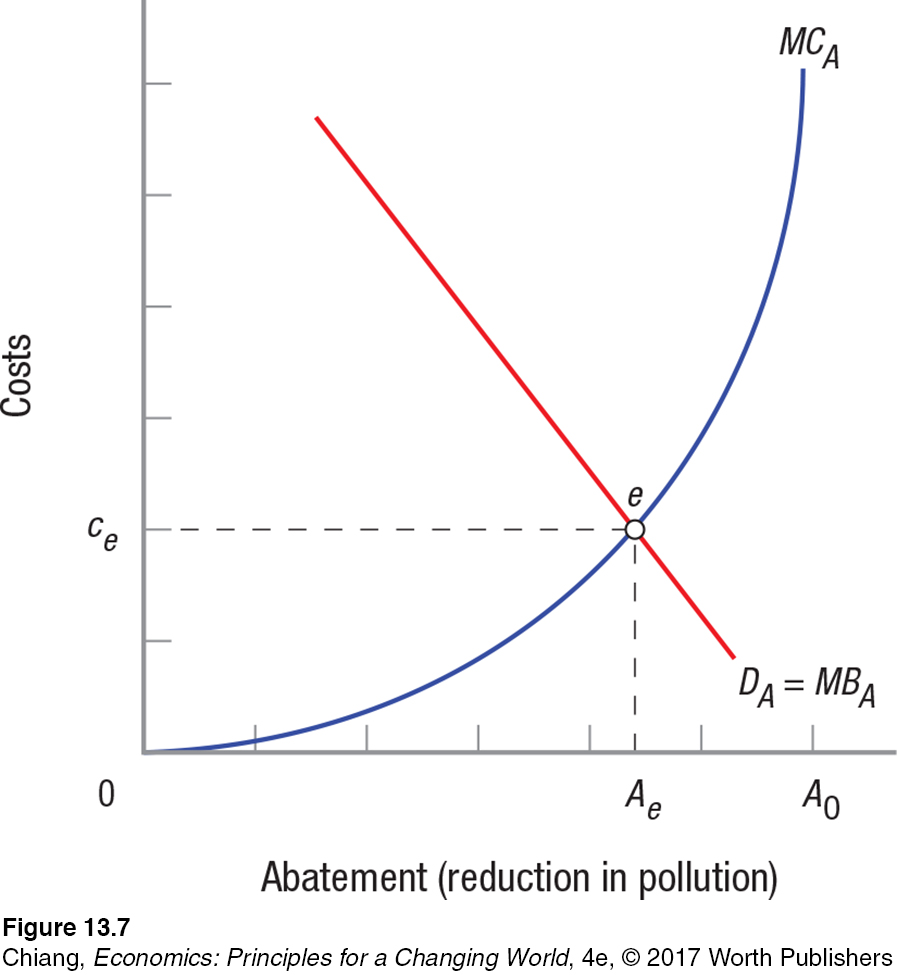
Policymakers determine the pollution control or abatement that is best, then introduce the most efficient policies to achieve those ends. Figure 7 shows the supply and demand for pollution abatement. Demand curve DA = MBA represents society’s demand for abatement; it is a reflection of the marginal damage curve we looked at earlier. Note that the demand curve for abatement is negatively sloped because the marginal benefit from abatement declines as the environment becomes cleaner. The gains from an ever cleaner environment eventually become smaller and smaller because of the law of diminishing returns.

The marginal costs of abatement are the costs of cleaning up pollution. These costs rise with abatement efforts and become high as zero pollution, A0, is approached. Optimal abatement comes at Ae, costing ce. This means that optimal pollution, A0 − Ae, is greater than zero. Command and control policies could set Ae as the abatement requirement and then set the right standards to meet this requirement. Aiming for abatement higher than Ae would be inefficient, because marginal costs would exceed marginal benefits.
Setting abatement requirements (or standards) equal to Ae in Figure 7 is a classic example of a command and control policy. Again, command and control policies that set rigid standards for polluters have long been a favorite of policymakers. Yet, this approach can lead to inefficiencies, because different industries may emit the same (or equivalently dangerous) substances, but face different technical problems and costs in reducing their pollution. To minimize the cost of reducing pollution, each source of pollution needs to be reduced to the point at which the marginal cost of abatement is equal for all sources. This can be achieved through market-
Market-Based Policies
Economists argue that market-
Pigouvian tax A tax that is placed on an activity generating negative externalities in order to achieve a socially efficient outcome.
Emissions Taxes An alternative to command and control policies is an emissions tax on every unit of pollution produced to achieve the socially efficient outcome. Taxes of this sort are known as Pigouvian taxes (named after Arthur Pigou who developed the idea in 1920). Unlike command and control policies, polluting firms are not limited to a fixed amount of pollution. Instead, by forcing firms to pay for every unit of pollution created, firms would invest in pollution reduction measures up to the point at which the cost of abatement measures is no longer less than the tax. Such policies take into account the fact that some firms are able to reduce pollution at less cost than others. Therefore, it creates efficiencies by allowing firms with higher costs of pollution abatement to pollute more by paying more taxes, while encouraging firms with lower costs of pollution abatement to utilize such measures to reduce their tax burden.
Returning to Figure 7, achieving the optimal level of pollution abatement, Ae, could be achieved by charging a tax equal to ce per unit of pollution. Firms would adopt pollution controls up to Ae, because the costs to reduce pollution to this point are less than the tax. Firms would emit only A0 − Ae pollution. As a result, the same level of abatement is achieved using taxes as with using command and control policies; however, allowing the market to achieve this outcome through taxes allows for a more efficient outcome for the firms involved.
Marketable or Tradable Permits Another way that markets are used to limit pollution is through the use of marketable or tradable permits. Economists initially proposed marketable or tradable permits when environmental laws were first being debated and enacted in the 1960s and 1970s. Environmental regulators essentially ignored this suggestion until the 1990s.
Today, tradable permits are used to reduce water effluents in the Fox River in Wisconsin, Tar-
Marketable permits require that a regulatory body set a maximum allowable quantity of effluents allowed, typically called the “cap,” and issue permits granting the “right” to pollute a certain amount. These permits can be bought and sold, thus creating the property rights that permit transactions of the sort Coase advocated. Sales are normally between two polluters, with one polluter buying a permit from a more efficient operator. Polluters do not have to be the only purchasers. Victims or environmental groups could conceivably purchase pollution rights and hold them off the market, thereby reducing pollution below the established cap.
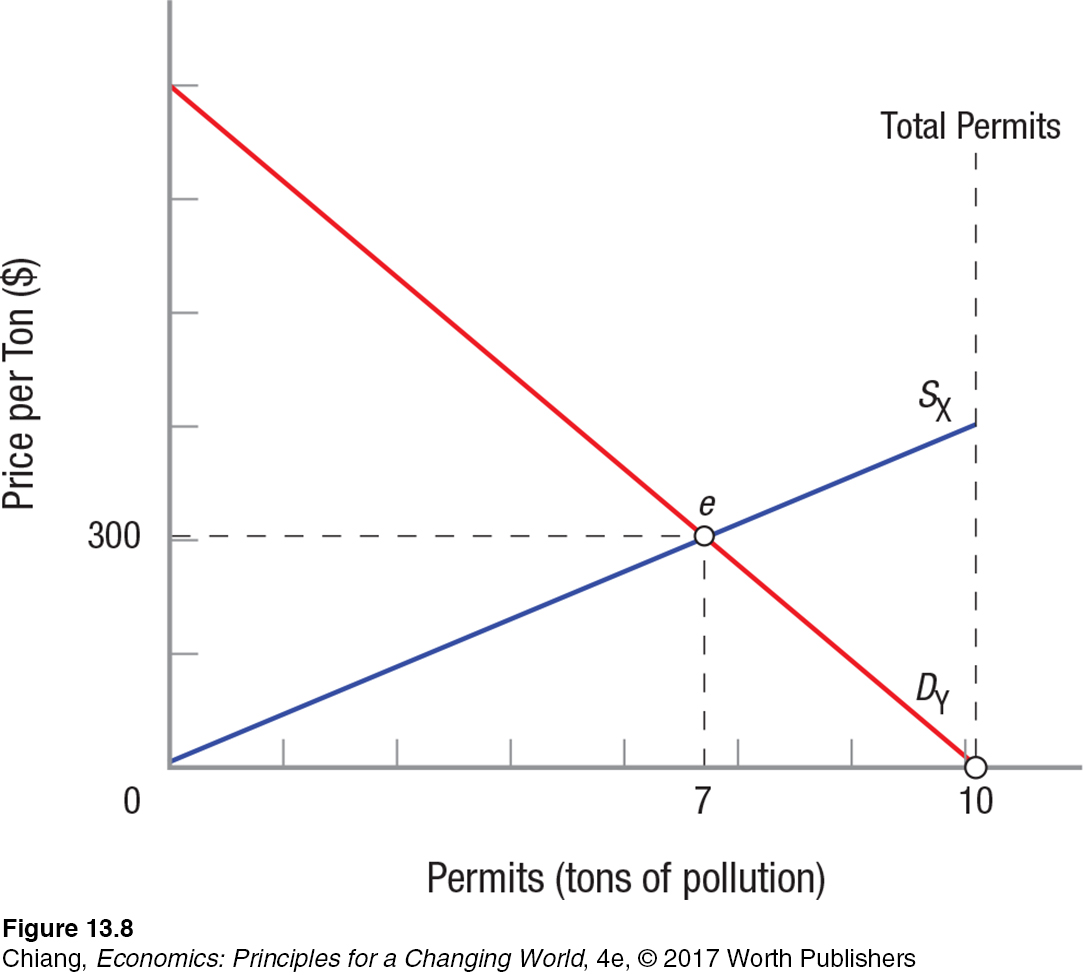
Figure 8 illustrates how such a market works. We assume that there are two firms in the market, each producing 10 tons of pollution, and that the government wishes to limit pollution to a total of 10 tons. Without restrictions, firms do zero abatement and total pollution is 20 tons. Setting a goal of 10 tons amounts to cutting pollution in half.

Assume, for simplicity, that the government at first gives the permits to firm X. (Remember that the Coase theorem suggests efficiency is not affected by who owns the rights to pollute.) Demand curve DY represents firm Y’s demand for these permits, while supply curve SX represents firm X’s willingness to sell some of the permits it was granted. Assume that the market for permits is competitive; thus, equilibrium will be at point e with a permit price equal to $300. Firm Y buys 7 permits and pollutes that amount, and firm X pollutes 3 tons.
Firm X pollutes less and sells 7 permits to firm Y because it can reduce more of its pollution before its marginal abatement costs reach $300. In this case, firm Y faces high cleanup costs that reach $300 a ton at 3 tons. Thus, it buys 7 tons of pollution rights from firm X. Firm X in this example ends up with the revenue from permit sales, while firm Y’s income declines by the same amount ($2,100). Auctioning off the permits produces the same result, but the government receives the revenue.
Keep in mind that regulators could have set a $300 per ton tax on effluents and achieved the same result. One advantage of permits over taxes is that no knowledge of marginal abatement costs is needed to ensure that the tax rate is optimal. The market price of permits will adjust to variances in abatement costs. All the regulator must determine is how much to reduce pollution levels. If reducing pollution by a certain amount, regardless of the cost, is the goal, permits will achieve this goal.
Other Market-
Federal subsidies, the flip side of taxes or charges, are used when local communities do not have the resources for pollution control. Marketable permits have been most successful in programs to reduce air pollution, as well as those targeting acid rain and ozone reduction. Deposit-
Over the years, most environmental policies have been of the command and control variety. The 1970 Clean Air Act focused on specific forms of air pollution—
One reason for this is probably that many people in the regulatory and environmental communities resist viewing environmental resources as commodities to be subjected to market forces of supply and demand. It is market failures, after all, that led to environmental decay in the first place. Why would we want to put the environment on the market? Many pollutants, moreover, are frequently mixed together and their individual impacts are difficult to determine. Consequently, setting the right tax rate or issuing the right number of allowable permits is difficult. Finally, some policymakers balk at giving corporations the right to pollute, even a limited amount.
ISSUE
Cap-
Environmental policies in recent decades have epitomized the battle between liberal environmentalists and free-
In the late 1980s, the problem of acid rain reached a boiling point, with heavy pollution from sulfur dioxide emissions causing health issues, polluted lakes and rivers, and reduced visibility. Further, it heightened tensions with Canada, which suffered negative externalities from the pollution from American power plants. With the environmental damage reaching front-
Then came a very unlikely alliance between Dan Dukek of the Environmental Defense Fund and Boyden Gray, a multimillionaire conservative who was appointed President Bush’s White House counsel in 1988. Gray, a strong proponent of free-

The program became law with the Clean Air Act of 1990. When the law, which became known as “cap-
Today, much discussion centers on the proposed use of cap-
Information from Richard Conniff, “The Political History of Cap and Trade,” Smithsonian, August 2009.
CHECKPOINT
ENVIRONMENTAL POLICY
Government failure can occur when politicians and government do not have the right incentives to bring about an optimal allocation of resources.
The discount rate chosen for environmental policies determines the intergenerational impact of policy.
The socially optimal level of pollution occurs where the marginal damage is equal to the marginal abatement costs.
Policymakers determine the optimal pollution levels and then often use command and control policies to set the most efficient regulations or levels of abatement.
Tradable permits use market forces to bring pollution within limits set by regulators.
QUESTIONS: If a cap-
Answers to the Checkpoint questions can be found at the end of this chapter.
If the cap on total carbon dioxide emissions is reduced each year while economic activity stays the same, permit prices would rise to encourage firms to produce less to meet the cap. In order for permit prices to fall, the costs of pollution abatement must fall due to technological advances, or new production methods (using clean energy) must be introduced to emit less carbon dioxide.