INFLATION
Suppose that 20 years ago, your parents put aside $18,200 each for your and your twin sister’s college education, which was the average cost of four years of tuition at a public university at that time. Your money was placed into a savings account that earned 1.5% interest per year on average, and your sister’s money was placed into a Treasury Inflation-
inflation A general rise in prices throughout the economy. It is a measure of changes in the cost of living.
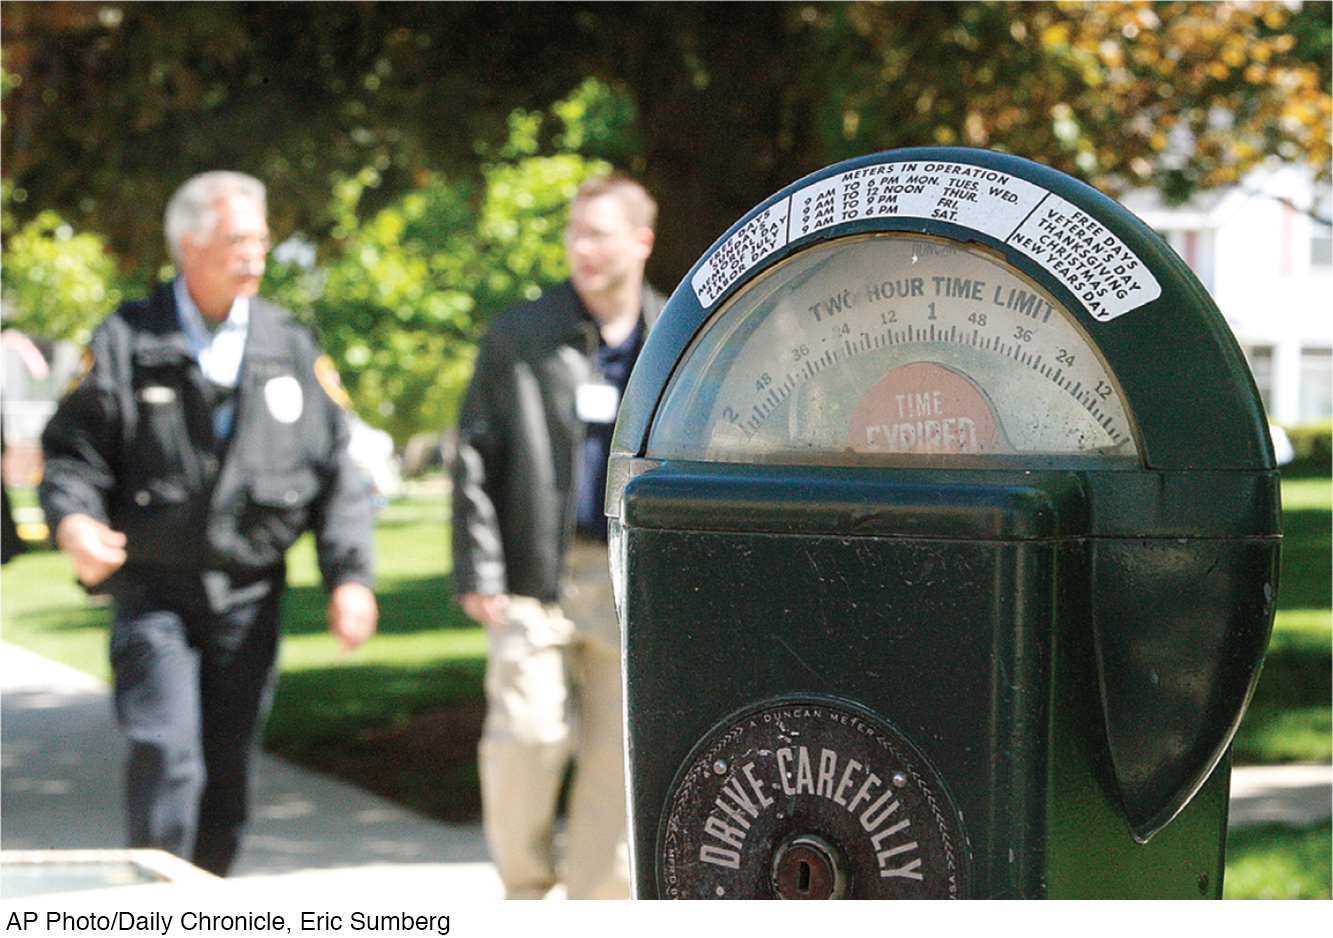
Prices are constantly changing for the goods and services we buy. Prices for items such as concert tickets, airline tickets, and fast-
How do individuals protect themselves against rising prices? First, workers demand higher wages to compensate for higher prices. But in a weak economy, wage increases are not always possible, especially when many people are out of work and willing to work for lower wages. Second, individuals with money saved can invest that money in assets that earn interest or can increase in value over time. Holding cash, for example, does not earn interest and therefore does not protect one against inflation.
Many forms of assets pay interest, including savings accounts, certificates of deposit (CDs), bonds, and money market accounts. But they do not pay equal amounts—
| TABLE 1 | A COMPARISON OF TWO INVESTMENTS | |||||
| 1997 | 2017 | |||||
| Average price of 4 years of tuition at a public college or university | $18,200 | $38,800 | ||||
| Value of $18,200 held in cash | $18,200 | $18,200 | ||||
| Value of $18,200 held in a savings account | $18,200 | $24,513 | ||||
| Value of $18,200 in a TIPS bond | $18,200 | $38,372 | ||||
What Causes Inflation?
Inflation is a measure of changes in the cost of living. In an economy like ours, prices are constantly changing. Some go up as others go down, and some prices rise and fall seasonally. Inflation is caused by many different factors, but the primary reasons can be attributed to demand factors, supply shocks, and government policy.
First, prices for goods and services are influenced by demand factors such as consumer confidence, income, or wealth. Think of a busy mall or restaurant. When there are plenty of customers, businesses are not pressured to offer discounts to attract buyers. This keeps prices higher than when consumer demand is depressed. For this reason, economic growth tends to coincide with inflation as a result of the demand for goods and services that higher incomes produce.
Second, prices are affected by supply shocks, caused by fluctuations in the price of inputs such as oil, natural resources, and farm crops. Over the last decade, the average price of a gallon of gasoline skyrocketed from less than $2 to nearly $4 a gallon due to increased demand for energy worldwide (especially in emerging countries such as China and India). But more recently, as a result of a glut in oil production and decreased global demand, gasoline prices fell back to below $2 a gallon. Farm products have seen similar fluctuations in prices as droughts and other natural disasters disrupt the supply of crops. When input prices rise, this not only raises the cost of living for individuals, but also raises the cost for businesses to produce and transport goods once produced. These higher costs of doing business typically are passed on to consumers in the form of higher prices. When input prices fall, we generally expect the opposite effect on prices to occur.
Lastly, inflation can result from specific government actions. Government has a great power that no one individual has—
Now that we have described the main causes of inflation, let’s discuss how inflation is measured.
Measuring Inflation: Consumer Price Index, Producer Price Index, and GDP Deflator
price level The absolute level of a price index, whether the consumer price index (CPI; retail prices), the producer price index (PPI; wholesale prices), or the GDP deflator (average price of all items in GDP).
disinflation A reduction in the rate of inflation. An economy experiencing disinflation still faces inflation, but at a declining rate.
deflation A decline in overall prices throughout the economy. This is the opposite of inflation.
Each month, the U.S. Department of Labor, through its Bureau of Labor Statistics (BLS), reports several important statistics that provide us with our principal measure of inflation. It does so by reporting changes in the average level of prices over the previous month in terms of the price level. The price level is the absolute level of a price index, whether this is the consumer price index (CPI; retail prices), the producer price index (PPI; wholesale prices), or the GDP deflator (average price of all items in GDP). The percentage increase in prices over a 12-
Because inflation rates fluctuate up and down, the term disinflation is used to describe a reduction in the rate of inflation. Note that an economy going through disinflation still experiences rising prices, just at a slower pace. This was the case from the mid-
Measuring consumer spending and inflation is one of the oldest data-
The consumer price index (CPI) An index of the average prices paid by urban consumers for a typical market basket of consumer goods and services.
Consumer Price Index The consumer price index (CPI) is an index of the average prices paid by urban consumers (CPI-
The CPI is often referred to as a “cost-
Why does CPI use a fixed bundle of goods and services? First, this avoids having to measure how consumers react to price changes; for example, if the price of beef rises, people might buy more chicken. Second, because it is difficult to follow every decision made by consumers, the government measures how prices change for a fixed basket of goods that an average consumer would buy.
The CPI is calculated by dividing the market basket’s cost in the current period by its cost in the base period. The current CPI is a cost-
How the Bureau of Labor Statistics Measures Changes in Consumer Prices Measuring consumer prices requires the work of many people. Data collectors record about 83,000 prices in 87 urban areas each month from selected department stores, supermarkets, service stations, doctors’ offices, rental offices, and more. Yet, the BLS does not have enough resources to price all goods and services in all retail outlets; therefore, it uses three sample groups to approximate the spending behavior of all urban consumers. These include a Consumer Expenditure Survey tracking the spending habits of over 30,000 families nationwide used to construct the market basket of goods and services, a Point-
Goods and services are divided into more than 200 categories, with each category specifying over 200 items for monthly price collection. Data from the three surveys are combined, weighted, and used to compute the cost in the current period required to purchase the fixed market basket of goods. This cost is then compared to the base period to calculate the CPI using the following formula:
CPI = (Cost in Current Period ÷ Cost in Base Period) × 100
For example, assume that the market basket of goods cost $5,000 in 2011 and that the same basket of goods now costs $5,750. The CPI for today, using 2011 for the base year, is
115.0 = ($5,750 ÷ $5,000) × 100
Therefore, the cost of goods has risen by 15% over this time period because the index in the base year (2011 in this case) is always 100. Again, the choice of base year does not matter as long as the CPI for each year is calculated relative to the cost in the selected base year. In fact, one can use CPI data as reported by the BLS to calculate price changes between any two years, neither of which is the base year, using the following formula:
% Change in Price = [(CPI in Current Year/CPI in Original Year) × 100] − 100
For example, if the CPI in 2016 was 238.6 and the CPI in 2011 was 224.9, the average change in prices over this five-
6.1% = [(238.6/224.9) × 100] − 100
We now take a quick look at some of the problems inherent in the current approach to measuring the CPI.
Problems in Measuring Consumer Prices The CPI is a conditional cost-
But even if we ignore the environmental factors and public services, the CPI still tends to overstate inflation for three key reasons: product substitution, quality improvements, and the introduction of new products.
The CPI uses a fixed market basket determined by consumer expenditure surveys that often are three to five years old. The CPI assumes that consumers continue to purchase the same basket of goods from one year to the next. We know, however, that when the price of one good rises, consumers substitute other goods that have fallen in price, or at least did not rise as much.
Also, in any given year, about 30% of the products in the market basket will disappear from store shelves. Data collectors can directly substitute other products for roughly two-
Another problem for CPI is the introduction of new products. Not too long ago, digital streaming of books, music, and movies did not exist. Neither did iPads and other devices allowing these media to be played. Because technology is constantly changing along with the prices of technology goods, the BLS often waits until a product matures and is used by a significant number of consumers before including it in the market basket. By not measuring the benefits of new products that consumers enjoy, the actual rate of inflation will be overstated.
One final difficulty to note has to do with measuring the changing costs of health care. The CPI looks only at consumers’ out-
One solution to these problems was the introduction of an indicator by the BLS called C-
The difference in magnitudes between CPI-
producer price index (PPI) An index of the average prices received by domestic producers for their output.
The Producer Price Index The producer price index (PPI) is an index of the average prices received by domestic producers for their output. Before 1978 this index was known as the wholesale price index (WPI). The PPI is compiled by doing extensive sampling of nearly every industry in the mining and manufacturing sectors of our economy.
The PPI contains the following:
Price indexes for roughly 500 mining and manufacturing industries, including over 10,000 indexes for specific products and product categories
Over 3,700 commodity price indexes organized by type of product and end use
About 800 indexes for specific outputs of industries in the service sector, and other sectors that do not produce physical products
Several major aggregate measures of price changes, organized by stage of processing, both commodity-
based and industry- based
The PPI measures the net revenue accruing to a representative firm for specific products. Because the PPI measures net revenues received by the firm, excise taxes are excluded, but changes in sales promotion programs such as rebate offers or zero-
GDP deflator An index of the average prices for all goods and services in the economy, including consumer goods, investment goods, government goods and services, and exports. It is the broadest measure of inflation in the national income and product accounts (NIPA).
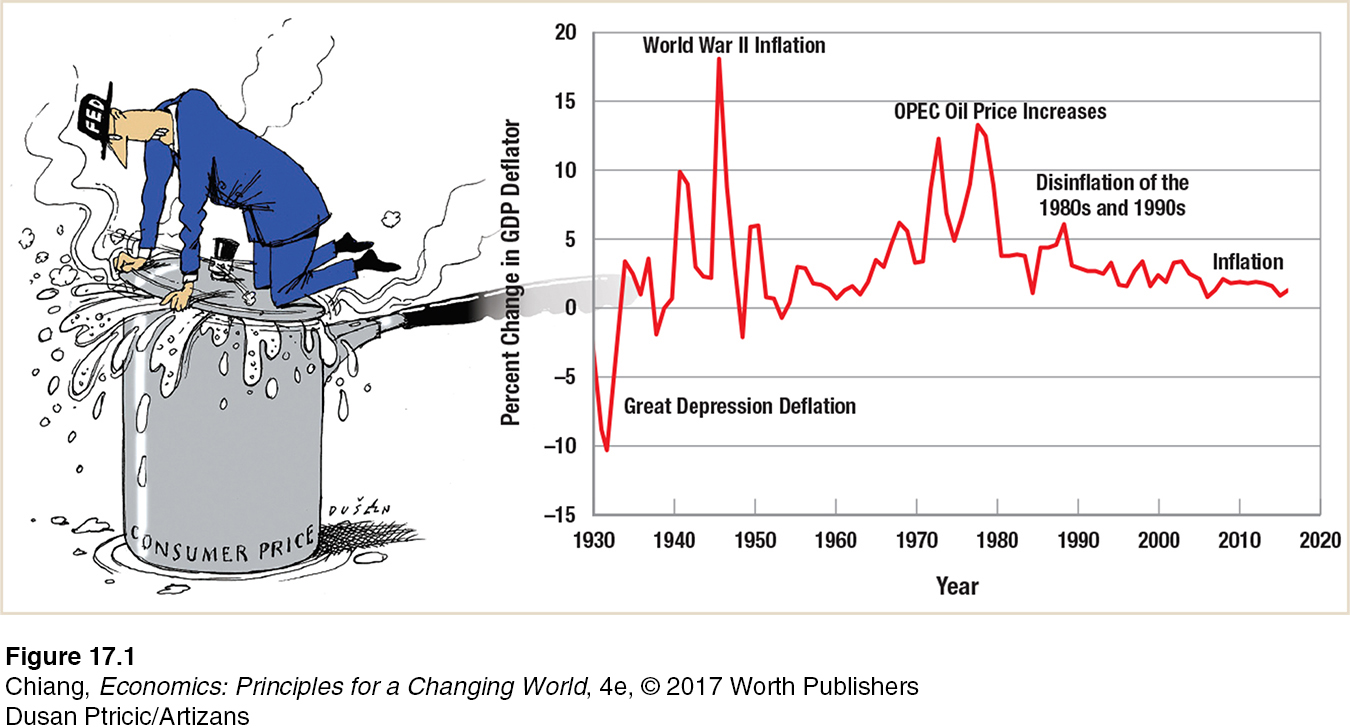
The GDP Deflator The GDP deflator shown in Figure 1 is our broadest measure of inflation. It is an index of the average prices for all goods and services in the economy, including consumer goods, investment goods, government goods and services, and exports. The prices of imports are excluded. Note that deflation occurred in the Great Depression. The spike in inflation occurred just after the end of World War II, when price controls were lifted. Since the mid-
Adjusting for Inflation: Escalating and Deflating Series (Nominal Versus Real Values)
Price indexes are used for two primary purposes: escalation and deflation. An escalator agreement modifies future payments, usually increasing them, to take the effects of inflation into account. Deflating a series of data with an index involves adjusting some current value (often called the nominal value) for the impact of inflation, thereby creating what economists call a real value. Using the GDP deflator, for instance, to deflate annual GDP involves adjusting nominal GDP to account for inflation, thereby yielding real GDP, or GDP adjusted for inflation.
Escalator Clauses Many contracts, including commercial rental agreements, labor union contracts, and Social Security payments are subject to escalator clauses. An escalator clause is designed to adjust payments or wages for changes in the price level. Social Security payments, for example, are adjusted upward (and referred to as a cost-
Escalator clauses become important in times of rising or significant inflation. These clauses protect the real value of wages as well as payments such as Social Security. In fact, voting blocs and organizations such as AARP have been formed to protect those who depend on escalator clauses to maintain their standards of living.
However, over the past decade, low inflation rates have correspondingly resulted in tiny increases in benefits. In fact, in 2009, 2010, 2015, and 2016, inflation was so low (around 0%) that no increase in Social Security benefits occurred. This caused some concern among many seniors because the lack of inflation in 2015 and 2016 was due to a large drop in energy prices, despite higher prices for food and health care, items on which seniors are more likely to spend their money. In general, though, escalator clauses are important because they do protect people from spikes in the overall price level.
Deflating Series: Nominal Versus Real Values GDP grew by 22% from 2008 to 2016, but should we be celebrating? Not really, because inflation has eroded the purchasing power of that increase. The question is, by how much did GDP really increase?
First, remember that every index is grounded on a base year, and that the value for this base year is always 100. The base year used for the GDP deflator, for instance, is 2008. The formula for converting a nominal value, or current dollar value, to real value, or constant dollar value, is
Real = Nominal × (Base Year Index ÷ Current Year Index)
To illustrate, nominal GDP in 2016 was $18,128.2 billion. The GDP deflator, having been 100 in 2008, was 112.3 in 2016. Real GDP for 2016 (in 2008 dollars) was therefore
$16,142.6 billion = $18,128.2 billion × (100.0 ÷ 112.3).
Note that because the economy has faced some inflation—
The Effect of Overstating Inflation Many federal benefits, including Social Security payments, food stamps, and veterans’ benefits, are indexed to the CPI, which means that if inflation (as measured by the CPI) goes up by 3%, these benefits are increased by 3%. If the CPI overstates inflation, federal expenditures on benefits are higher. Although individuals initially benefit from the higher payments, overstating inflation in the long run makes real earnings appear smaller than what they actually are. This leads to a different set of issues for policymakers and our economy.
Because CPI had been estimated to overstate inflation, in 1999 the Department of Labor revised its measurement tools used for estimating inflation. As a result, today’s CPI is a more accurate measure of inflation.
The Consequences of Inflation
Why do so many policymakers, businesspeople, and consumers dread inflation? Your attitude toward inflation will depend in large part on whether you live on a fixed income, whether you are a creditor or debtor, and whether you have properly anticipated inflation.
Many elderly people live on fixed incomes; often, only their Social Security payments are indexed to inflation. People on fixed incomes are harmed by inflation because the purchasing power of their income declines. If people live long enough on fixed incomes, inflation can reduce them from living comfortably to living in poverty.
Creditors, meanwhile, are harmed by inflation because both the principal on loans and interest payments are usually fixed. Inflation reduces the real value of the payments they receive, while the value of the principal declines in real terms. This means that debtors benefit from inflation; the real value of their payments declines as their wages rise with inflation. Many homeowners in the 1970s and 1980s saw the value of their real estate rise from inflation. At the same time, their wages rose, again partly due to inflation, but their mortgage payment remained fixed. The result was that a smaller part of the typical household’s income was needed to pay the mortgage. Inflation thus redistributes income from creditors to debtors.
This result takes place only if the inflation is unanticipated. If lenders foresee inflation, they will adjust the interest rates they offer to offset the inflation expected over the period of the loan. Suppose, for instance, that the interest rate during zero inflation periods is roughly 3%. Now suppose that a lender expects inflation to run 5% a year over the next three years, the life of a proposed loan. The lender will demand an 8% interest rate to adjust for the expected losses caused by inflation. Only when lenders fail to anticipate inflation does it harm them, to the benefit of debtors.
But the effects of unexpected inflation do not stop there. When inflation is unexpected, the incentives individuals and firms face change. For example, suppose that inflation causes prices of everyday purchases along with wages to increase by 5%. If this inflationary effect was anticipated, then consumption decisions should not change, because real prices stay the same when prices and wages rise by the same amount. But if the price rise was unexpected, it might cause consumers to reduce their consumption, leading to lower spending in the economy. For firms, if an increase in money due to unexpected inflation causes demand for their products to rise at their original prices, firms might react by increasing production (and their costs) rather than adjusting their prices when actual demand has not changed. Therefore, unexpected inflation leads to faulty signals, which can reduce consumer and producer welfare.
Lastly, when inflation becomes rampant, individuals and firms expend resources to protect themselves from the harmful effects of rapidly rising prices, an effect that is especially prevalent in cases of hyperinflation.
Hyperinflation
hyperinflation An extremely high rate of inflation; above 100% per year.
Hyperinflation is an extremely high rate of inflation. Today, most economists refer to an inflation rate above 100% a year as hyperinflation. But in most episodes of hyperinflation, the inflation rates dwarf 100% a year. In 2008 in Zimbabwe, prices were more than doubling every day, for an annual inflation rate of 231,000,000%.
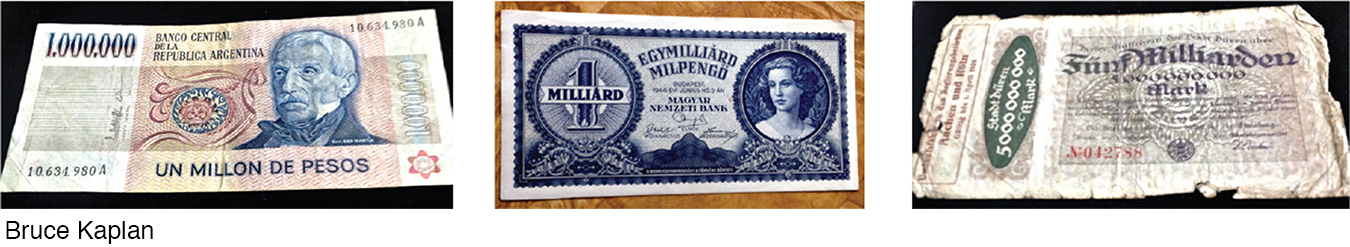
Hyperinflation is not new. It has been around since paper money and debt were invented. During the American Revolutionary War, the Continental Congress issued money until the phrase “not worth a continental” became part of the language. Germany experienced the first modern hyperinflation after World War I. Hungary experienced the highest rate of inflation on record during World War II. By the end of the war, it took over 800 octillion (8 followed by 29 zeros) Hungarian pengos to equal 1 prewar pengo.
ISSUE
The Consequences of Counterfeit Money on Inflation
Each day, hundreds of billions of U.S. dollars exchange hands in everyday transactions. A small fraction of these dollars are counterfeit, circulating throughout the economy as if they were genuine. When counterfeit money is created, who ends up paying for it?
Suppose you receive some money, and later realize one of the bills is fake (the ink runs, the paper is too thin, or the watermark is missing). What can you do? Many people assume they could go to a bank and exchange the fake bill for a real one. But most banks won’t accept a fake bill because then the bank would lose the money. Some people pass the fake to the next unsuspecting person, but this is a punishable offense. The law states that a counterfeit bill must be reported to the nearest U.S. Secret Service field office. By doing so, you still lose the money, as there is no compensation for turning in counterfeit money.
Thus, the responsibility lies with individuals and businesses to check the authenticity of the money received, and to refuse money that appears to be counterfeit. That is not always as easy as it sounds. A low-

Restaurants and other businesses often receive counterfeits because cashiers are rushed. Consumers sometimes pass them to businesses thinking it won’t hurt them. Because banks generally do not accept counterfeits, businesses with counterfeits incur a loss that acts as a tax on the business, which leads to higher prices. Therefore, even if individuals do not end up with the counterfeit in their possession, they pay for them in the form of higher prices.
What happens when a high-
When more money chases a limited amount of goods and services in an economy, inflation arises. Because counterfeits produce the same effect as an increase in the money supply, inflation will occur. In sum, counterfeits hurt everyone, which is why governments invest in new technology to produce money with many security features.
Hyperinflation is usually caused by an excess of government spending over tax revenues (extremely high deficits) coupled with the printing of money to finance these deficits. Post–
Stopping hyperinflation requires restoring confidence in the government’s ability to bring its budget under control. It usually requires a change in government and a new currency, and most important a commitment to reduce the growth of the money supply.
Hyperinflation is an extreme case, yet it shows how inflation can have detrimental effects on an economy. This is why it is important to keep track of inflation, as it is an important measure of the health of an economy.
CHECKPOINT
INFLATION
Inflation is a measure of the change in the cost of living.
Inflation is a general rise in prices throughout the economy.
Disinflation is a reduction in the rate of inflation, and deflation is a decline in overall prices in the economy.
The CPI is a price index used to measure inflation for urban consumers and is based on a survey of a fixed market basket of goods and services each month.
The PPI is a price index used to measure price changes for the output of domestic producers.
The GDP deflator is the broadest measure of inflation and covers all goods and services in GDP.
Escalator clauses adjust payments (wages, rents, and other payments such as Social Security) to account for inflation.
Real (adjusted for inflation) values are found by multiplying the nominal (current dollar) values by the ratio of the base year index to the current year index.
Hyperinflation is an extremely high rate of inflation.
QUESTIONS: Suppose you took out $20,000 in student loans at a fixed interest rate of 5%. Assume that after you graduate, inflation rises significantly as you are paying back your loans. Does this rise in inflation benefit you in paying back your student loans? Who is hurt more from unexpected higher inflation—
Answers to the Checkpoint questions can be found at the end of this chapter.
Inflation makes the value of a dollar fall in purchasing power. Therefore, if you borrow money when inflation is low and pay back the loan when inflation is higher, the money you are paying back is worth less than what you received. You benefit by being able to pay back your loans with money that is valued at less than before. Thus, unexpected inflation hurts lenders because the money they are being paid back is worth less in purchasing power than they had planned. Alternatively, had the inflation rate unexpectedly fallen, lenders would gain, as the money being paid back would be worth more in purchasing power than was expected.