THE BUDGET LINE AND CHOICES
To begin an analysis of consumption choices, we first must consider how a limited income and the prices of goods and services put constraints on our choices.
The Budget Line
As a student, you came to college to improve your life not only intellectually but also financially. As a college graduate, you can expect your lifetime earnings to be triple those of someone with only a high school education. Even once you have achieved these higher earnings, there will be limits on what you can buy. But first, let us return to the present.
Assume you have $50 a week to spend on pizza and wall climbing. This is a proxy for a more general choice between food and entertainment. We could use different goods or more goods, but the principle would still be the same. In our specific example, if pizzas cost $10 each and an hour of wall climbing costs $20, you can climb walls for 2.5 hours or consume 5 pizzas each week, or do some combination of these two. Your options are plotted in Figure 1.
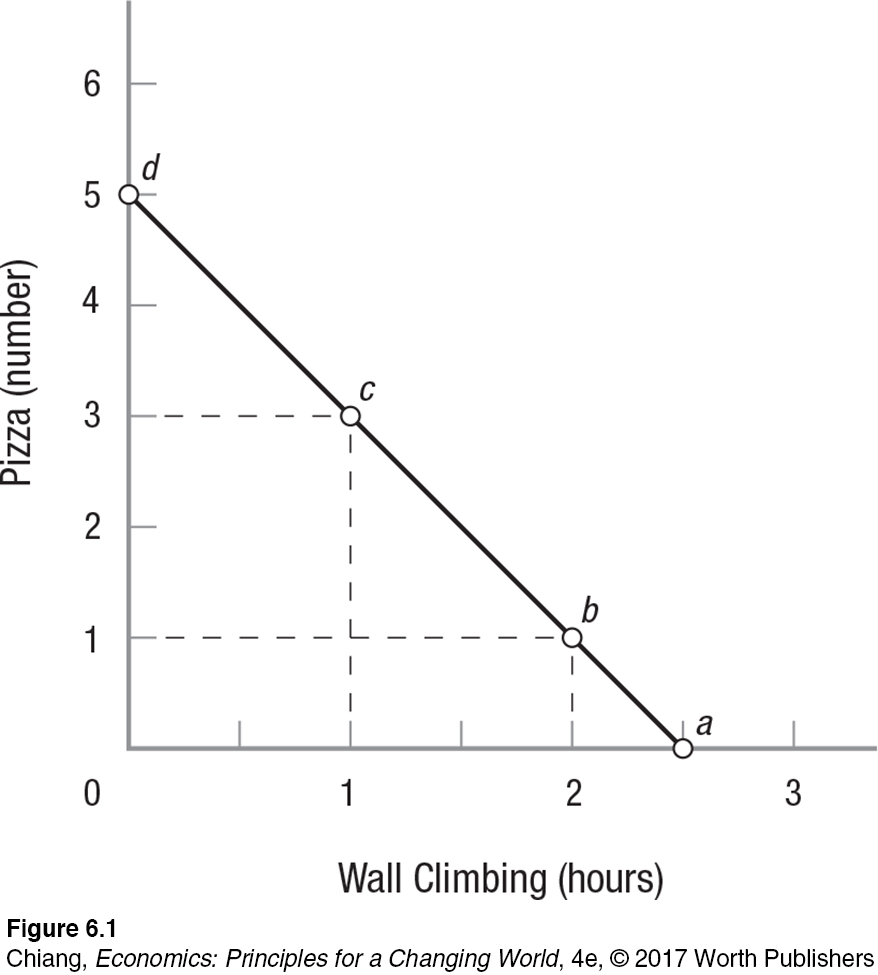
budget line A line that graphically illustrates the possible combinations of two goods that can be purchased with a given income, given the prices of both goods.
This budget line (constraint) is a lot like the production possibilities frontier (PPF) discussed in Chapter 2. Although you might prefer to have more of both goods, you are limited to consumption choices lying on the budget line, or inside the budget line if you want to save any part of your $50 weekly budget. As with the PPF, however, any points to the right of the line are unattainable for you—
In this example, the budget line makes clear that many different combinations of wall climbing and pizzas will exhaust your $50 budget. But which of these possible combinations will you select? That depends on your personal preferences. If you love pizza, you will probably make different choices than if you are a fitness fanatic who rarely consumes fatty foods. Your own preferences determine how much pleasure you can expect to get from the various possible options. We study how optimal choices are made in the next section of this chapter.
Changes to the Budget Line
The budget line, like most money matters, is subject to changes in the prices of goods or changes in income. When the price of a good or income changes, the combinations of goods that become affordable change as well. Let’s look at how the budget line changes.
Changes to the Price of a Good Suppose the wall-
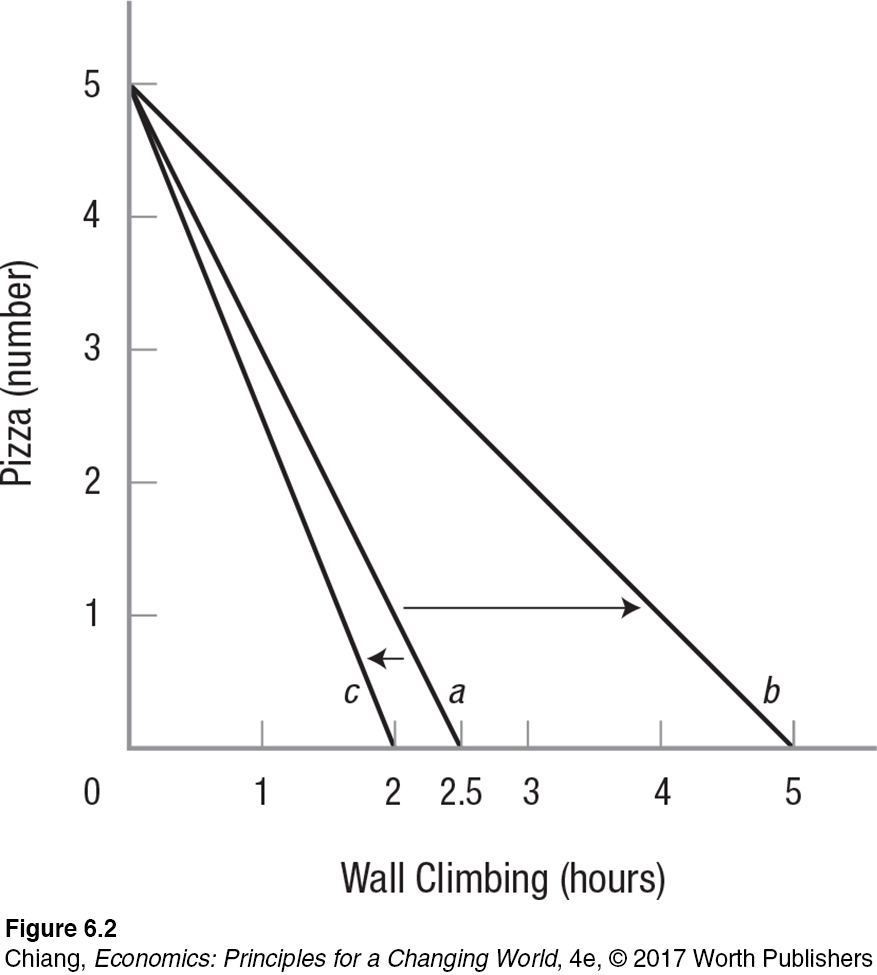
Notice that in this case it is possible for a person to actually consume more of both pizza and wall climbing, even though the price of pizza did not change, nor did the income of $50. Suppose that originally you would spend the entire $50 on wall climbing, purchasing 2.5 hours. Because the price is now $10, the new cost of maintaining the same purchase of 2.5 hours is $25, leaving $25 to use on either more wall climbing or pizza, or both. Even though your actual income did not change, you can now purchase more than you could before, as if you had a higher income. This is true for any point along the original budget line except for the one point at which the entire budget was spent on pizza. Only in this case does the fall in price of wall climbing not increase the number of pizzas that can be purchased.
Now suppose that instead of a discount on wall climbing, the gym decides to raise the price to $25. How would this affect the budget line? It pivots inward. In Figure 2, budget line c shows the maximum quantity of wall climbing decreasing to two hours. The increase in price reduces the combinations of both pizza and wall climbing that can be purchased with $50.
Changes to Income We now know that changes in the price of a good will pivot the budget line inward or outward along the axis for that good. But what if income itself changes? Suppose that prices of pizza and wall climbing remain at $10 and $20, respectively, but you are given extra money by your parents, allowing you to increase your food and entertainment budget to $100 per week. Figure 3 illustrates how an increase in income shifts your budget line outward to budget line b in a parallel fashion. Because $100 is double the original income, you can now afford twice as many pizzas and wall climbing hours as before as long as prices do not change. Budget line b shows that the maximum quantity of pizza that can be purchased increases to 10 and the maximum quantity of climbing hours increases to 5.
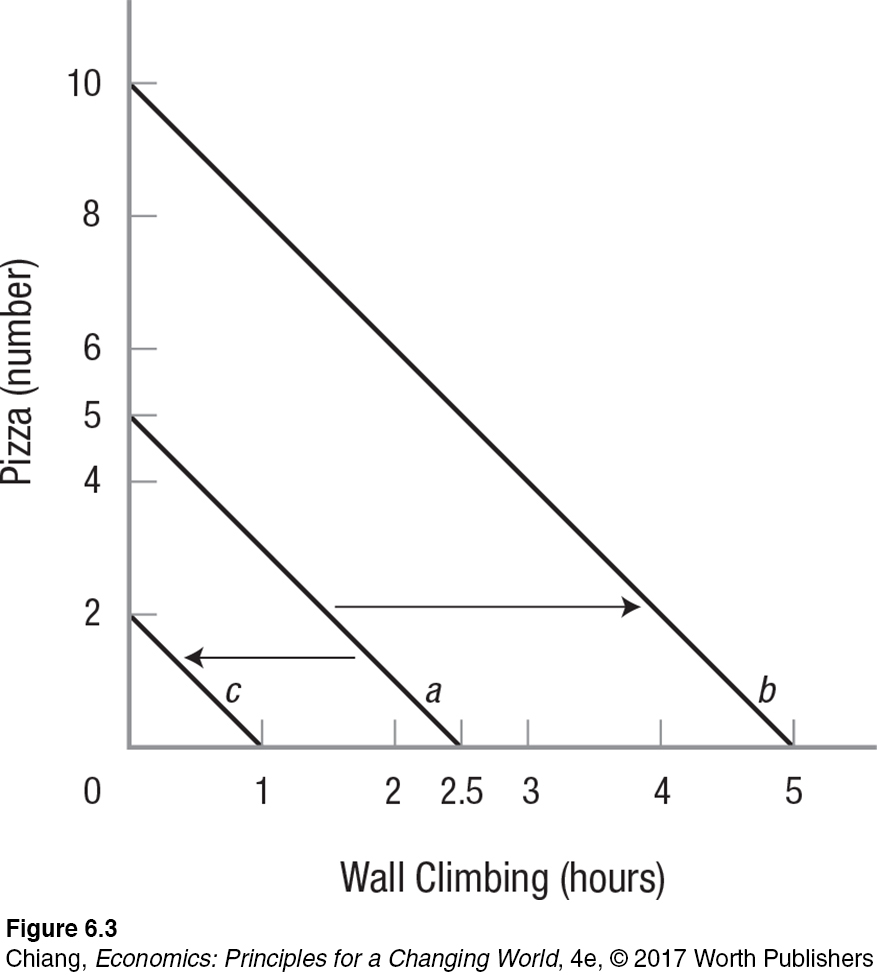
Similar to price changes, we can analyze the effect of a decrease in income on the budget line as well. Suppose increased expenses elsewhere force you to cut back on entertainment spending from $50 to $20 per week. Figure 3 shows how the reduced income shifts the budget line parallel inward to budget line c.
Now that we have analyzed how budget lines determine what we can afford, we must answer the important question of what combination of goods and services results in the highest satisfaction. One approach is to use marginal utility analysis, which we turn to next.
CHECKPOINT
THE BUDGET LINE AND CHOICES
The budget line graphically illustrates the limits on purchases for a given income (budget).
Changes in the price of a good cause the budget line to pivot inward or outward, affecting the combinations of goods that can be afforded.
When the price of one good decreases, perceived income increases, allowing one to purchase more of both goods.
Changes in income (budget) cause a parallel shift of the budget line.
QUESTION: Suppose that each week you eat ten meals on campus at $7.50 each and five meals off campus at $15 each. What is your total spending on meals? Suppose the price of off-
Answers to the Checkpoint questions can be found at the end of this chapter.
The total amount spent on meals each week is (10 × $7.50) + (5 × $15) = $150. If the price of off-