MARGINAL UTILITY ANALYSIS
The previous section showed how our choices of goods and services are limited to what we can afford given a budget. Similar to how PPFs showed the maximum output an economy can produce, budget lines show the maximum quantity of goods (in various combinations) that can be purchased. And like PPF analysis, an individual is able to select a point on the budget line that would maximize one’s satisfaction. But which point would accomplish this goal?
marginal utility analysis A theoretical framework underlying consumer decision making. This approach assumes that satisfaction can be measured and that consumers maximize satisfaction when the marginal utilities per dollar are equal for all products and services.
To answer this question, we need to determine which combination of goods and services results in the highest level of satisfaction. Solving this riddle of consumer behavior can be accomplished using marginal utility analysis. Let’s begin by defining preferences and utility, and then discuss how marginal utility analysis allows a person to maximize his or her well-
JEREMY BENTHAM (1748–1832)
Jeremy Bentham was a social philosopher, legal reformer, and writer who founded the philosophy known as utilitarianism. As an economic theorist, his most valuable contribution was the idea of utility, which explained consumer choices in terms of maximizing pleasure and minimizing pain.
Born in 1748, Bentham was the son of a wealthy lawyer. At age 12, he entered Oxford University, then studied for the bar although he decided not to practice law. Instead, he pursued a life of writing and thinking, with his primary contribution analyzing the notion of utility as a driving force in social and economic behavior. Bentham believed that the aim of society and government should be to maximize utility, or to promote the “greatest happiness for the greatest number.” In 1789 he published his most famous work, Introduction to the Principles of Morals, which laid out his utilitarian philosophy. Bentham believed it was possible to derive a “Felicific Calculus” to compare the various pleasures or pains.
Although modern economists have cast doubt on the notion that utility could be measured or calculated, Bentham had many ideas that were ahead of his time, including the notion of cost-
Preferences and Utility
utility A hypothetical measure of consumer satisfaction.
Utility is a hypothetical measure of consumer satisfaction. It was introduced by early economists attempting to explain how consumers make decisions. The utilitarian theory of consumer behavior assumes, first of all, that utility is something that can be measured. Returning to our example from the previous section, the theory assumes that we can quantify the utility (satisfaction) you derive from consuming one or more pizzas, and how much utility you derive from spending one or more hours on the climbing wall. Table 1 provides estimates of the utility you derive from both pizzas and wall climbing, measured in utils, hypothetical units of satisfaction or utility. Compare columns (1) and (2) with columns (4) and (5).
| TABLE 1 | TOTAL AND MARGINAL UTILITY FROM PIZZAS AND WALL CLIMBING | ||||
| Pizza | Wall Climbing | ||||
| (1) Quantity |
(2) Total Utility |
(3) Marginal Utility |
(4) Quantity |
(5) Total Utility |
(6) Marginal Utility |
| 0 | 0 | — | 0.0 | 0 | — |
| 1 | 70 | 70 | 0.5 | 90 | 90 |
| 2 | 130 | 60 | 1.0 | 170 | 80 |
| 3 | 180 | 50 | 1.5 | 230 | 60 |
| 4 | 220 | 40 | 2.0 | 260 | 30 |
| 5 | 250 | 30 | 2.5 | 270 | 10 |
At first glance, it might seem that if you wanted to maximize your utility given your $50 budget, you would simply go wall climbing for 2.5 hours, thereby maximizing your total utility at 270 utils. If you spent a little time analyzing the table, you would notice that combinations give you more total utility. If you went wall climbing for 2 hours and had 1 pizza (again spending your entire $50 budget), your total utility would be 330 utils (260 + 70 = 330), much more than concentrating on one item alone.
Other than trial and error, how do we determine the best combination? Before we can see just which combination of these two goods would actually bring you the most happiness, we need to distinguish between total utility and marginal utility.
total utility The total satisfaction that a person receives from consuming a given amount of goods and services.
Total and Marginal Utility Total utility is the total satisfaction that a person receives from consuming a given quantity of goods and services. In Table 1 the total utility received from consuming 3 pizzas is 180 utils, whereas the total utility from 4 pizzas is 220 utils. Marginal utility is something different.
marginal utility The additional satisfaction received from consuming one more unit of a given product or service.
Marginal utility is the additional satisfaction derived from consuming one more unit of a given product or service. It is determined by taking the difference between the total utility derived from, say, consuming 4 pizzas and consuming 3 pizzas. The total utility derived from 4 pizzas is 220 utils, and that from 3 pizzas is 180 utils. Therefore, consuming the fourth pizza yields only an additional 40 utils of satisfaction (220 – 180 = 40 utils).
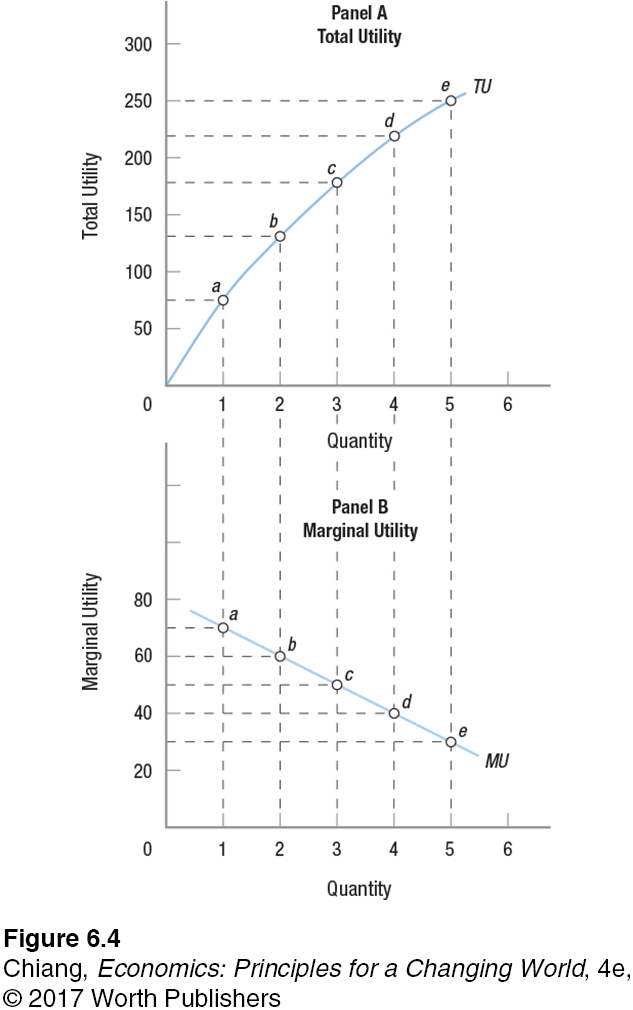
The marginal utility for both pizza eating and wall climbing is listed in Table 1. Notice that as we move from one quantity of pizza to the next, total utility rises by an amount exactly equal to marginal utility. This is no coincidence. Marginal utility is nothing but the change in total utility obtained from consuming one more pizza (the marginal pizza); therefore, as pizza eating increases by 1 pizza, total utility will rise by the amount of additional satisfaction derived from consuming that additional pizza. Also note that, for both pizzas and wall climbing, marginal utility declines as more of a particular product or activity is consumed.

The Law of Diminishing Marginal Utility Why does marginal utility decline as the consumption of one product or activity increases? No matter our personal tastes and preferences, we eventually become sated once we have consumed a certain amount of any given commodity. Most of us love ice cream. As youngsters, some of us imagined a world in which meals consisted of nothing but ice cream—
law of diminishing marginal utility As we consume more of a given product, the added satisfaction we get from consuming an additional unit declines.
This fact of human nature led early economists to formulate the law of diminishing marginal utility. This law states that as we consume more of a product, the rate at which our total satisfaction increases with the consumption of each additional unit will decline. And if we continue to consume still more of the product after that, our total satisfaction will eventually begin to decline.
This principle is illustrated by Figure 4, which graphs the total utility and marginal utility for pizza eating, as listed in Table 1. Notice that total utility, graphed in panel A, rises continually as we move from 1 pizza per week to 5 pizzas. Nevertheless, the rate of this increase declines as more pizzas are consumed. Accordingly, panel B shows that marginal utility declines with more pizzas eaten. On your student budget, you could not afford any more than 5 pizzas a week, but we can imagine that if you were to keep eating pizzas—
It is one thing to grasp the obvious fact that consumers have limited budgets and that the products they can choose among provide them increasing satisfaction but are subject to diminishing marginal utility. It is another thing to figure out exactly how consumers allocate their limited funds so as to maximize their total level of satisfaction or utility. We now turn our attention to how early economists solved the problem of maximizing utility and the analytic methods that resulted from their work.
Maximizing Utility Let’s take a moment to review everything we need to know to plot the budget line in Figure 1: your total income and the prices of all the products you could purchase. In our example, the weekly budget is $50, pizzas cost $10 apiece, and wall climbing is $20 per hour or $10 per half-
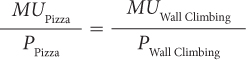
Given these options, how do individuals maximize their total utility from consuming various combinations of goods? Knowing the marginal utility of each unit of a good consumed is not enough. Surely, the marginal utility of a new car is greater than the marginal utility of a cup of coffee. But the price of the car is also much greater than the price of coffee. The ability to maximize utility given a fixed budget requires us to compare the marginal utilities per dollar spent on each good.
Take a look at columns (4) and (8) of Table 2. These two columns express the marginal utilities of pizzas and wall climbing, respectively, in terms of marginal utility per dollar; these amounts are computed by dividing the marginal utility of each product by the product’s price.
| TABLE 2 | TOTAL AND MARGINAL UTILITY PER DOLLAR FROM PIZZAS AND WALL CLIMBING | ||||||
| Pizza | Wall Climbing | ||||||
| (1) Quantity (units of pizza) |
(2) Total Utility |
(3) Marginal Utility |
(4) Marginal Utility per Dollar (price = $10) |
(5) Quantity (hours of wall climbing) |
(6) Total Utility |
(7) Marginal Utility |
(8) Marginal Utility per Dollar (price = $10 per half- |
| 0 | 0 | — | — | 0.0 | 0 | — | — |
| 1 | 70 | 70 | 7 | 0.5 | 90 | 90 | 9 |
| 2 | 130 | 60 | 6 | 1.0 | 170 | 80 | 8 |
| 3 | 180 | 50 | 5 | 1.5 | 230 | 60 | 6 |
| 4 | 220 | 40 | 4 | 2.0 | 260 | 30 | 3 |
| 5 | 250 | 30 | 3 | 2.5 | 270 | 10 | 1 |
To see the importance of computing marginal utility per dollar, consider the following. Given the figures in columns (4) and (8), and assuming you want to get the most for your money, on which activity would you spend the first $10 of your weekly budget? You can spend the first $10 on a pizza or on a half-
Now, for the sake of simplicity, let’s keep your spending increments constant. On what will you spend your next $10—
Proceeding in the same way, using your third $10 to buy your first pizza will yield an additional 70 utils of satisfaction, whereas using this money to purchase a third half-
The next $10 provides the same amount of utility (60 utils) regardless of whether you buy another pizza or another half-
By following this incremental process, we have determined that you will spend your $50 on 2 pizzas ($20) and 1.5 hours of wall climbing ($30). This results in a total utility of 360 utils (130 for pizza and 230 for wall climbing). This level is shown as the shaded row of Table 2. No other combination of pizzas and wall climbing will result in total satisfaction this high, as you can prove to yourself by trying to spend the $50 differently.
utility-
Note also that for the last 2 units of each product consumed, the marginal utilities per dollar were equal at 6. This result is to be expected. Simple logic tells us that if one activity yields more satisfaction per dollar than some other, you will continue to pursue the activity with the higher satisfaction per dollar until some other activity starts yielding more satisfaction. This observation leads to a simple rule for maximizing utility: You should allocate your budget so that the marginal utility per last dollar spent on each of your purchases is the same. This utility-
This equation and the analyses described earlier can be generalized to cover numerous goods and services. For all goods and services a, b, . . . n:
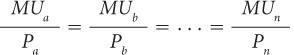
The important point to remember is that, according to this theory of consumer behavior, consumers approach every purchase by asking themselves which of all possible additional acts of consumption would bring them the most satisfaction per dollar.
You have seen how the marginal utility analysis of consumer behavior works when we assume that satisfaction or well-
Deriving Demand Curves
We know that consumers will maximize their utility by spending each dollar of their limited budgets on the goods and services yielding the highest marginal utility per dollar. In our previous example, with pizzas costing $10 each and an hour of wall climbing costing $20, this meant you bought 2 pizzas and 1.5 hours of wall climbing. Would your consumption choices change if these prices changed? Let us consider what happens when the cost of wall climbing increases to $30 per hour.
Now that wall climbing costs $30 per hour or $15 per half-
| TABLE 3 | TOTAL AND MARGINAL UTILITY PER DOLLAR FROM PIZZAS AND WALL CLIMBING (PRICE OF WALL CLIMBING INCREASES TO $30 PER HOUR OR $15 PER HALF- |
||||||
| Pizza | Wall Climbing | ||||||
| (1) Quantity (units of pizza) |
(2) Total Utility |
(3) Marginal Utility |
(4) Marginal Utility per Dollar (price = $10) |
(5) Quantity (hours of wall climbing) |
(6) Total Utility |
(7) Marginal Utility |
(8) Marginal Utility per Dollar (price = $15 per half- |
| 0 | 0 | — | — | 0.0 | 0 | — | — |
| 1 | 70 | 70 | 7 | 0.5 | 90 | 90 | 6.00 |
| 2 | 130 | 60 | 6 | 1.0 | 170 | 80 | 5.33 |
| 3 | 180 | 50 | 5 | 1.5 | 230 | 60 | 4.00 |
| 4 | 220 | 40 | 4 | 2.0 | 260 | 30 | 2.00 |
| 5 | 250 | 30 | 3 | 2.5 | 270 | 10 | 0.67 |
The next $25 is split between another pizza ($10) and a half-
Thus, your final allocation is 2 pizzas and 1 hour of wall climbing. Clearly, consumer choices respond to changes in product prices. With wall climbing at $20 per hour, you consumed 1.5 hours of climbing and 2 pizzas. When the price of wall climbing rose to $30 per hour, you altered your consumption. Now, instead of 1.5 hours and 2 pizzas, you consume 1 hour and 2 pizzas. This new level is shown in the shaded row of Table 3.
Figure 5 plots both your budget constraint and your demand for wall climbing based on the results of Tables 2 and 3. Panel A shows the effect of increasing the price of wall climbing from $20 to $30 per hour. At the increased price of wall climbing, if you were to spend your entire budget on this activity, you could only climb for 1.67 hours ($50/$30 = 1.67). This price increase rotates the budget line leftward, reducing your consumption opportunities, as the figure illustrates.
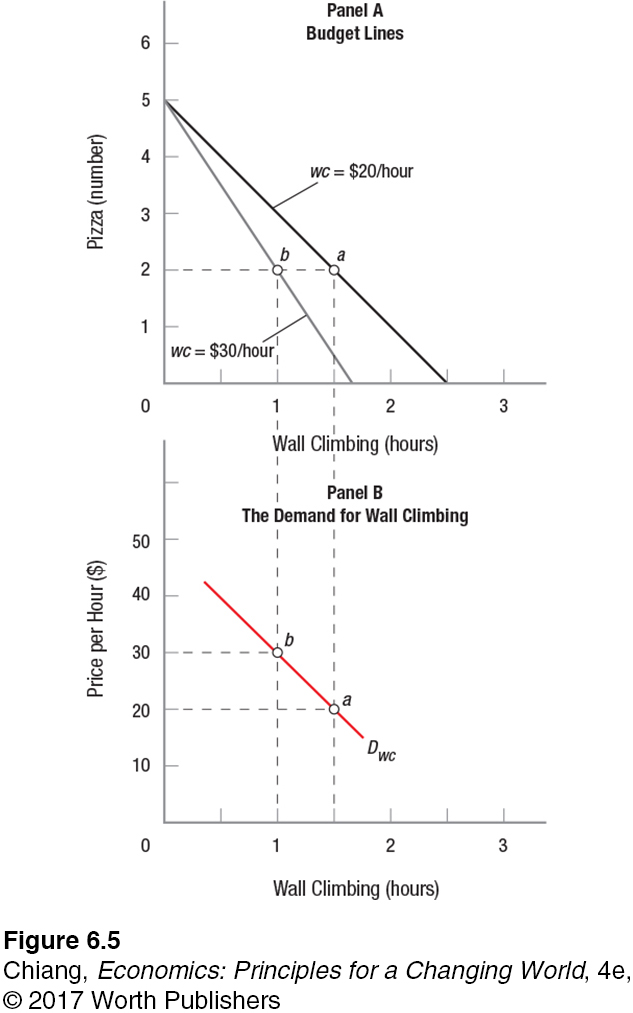
When the price of wall climbing was $20 per hour, you climbed for 1.5 hours (point a in both panels of Figure 5). When the price was increased to $30 per hour, marginal utility analysis led you to reduce your consumption of wall climbing to 1 hour (point b in both panels). Connecting these points in panel B of Figure 5 yields the demand curve for wall climbing.
Thus, the marginal utility theory of consumer behavior helps explain both how consumers allocate their income according to their personal preferences and the law of demand. Remember that the law of demand posited an inverse (negative) relationship between price and quantity demanded. This negative relationship is shown in panel B.
Limitations of Marginal Utility Analysis
Marginal utility analysis explains not only how consumers purchase goods and services but also how all household choices are made. We can analyze the decision of whether or not to get a job, for example, by comparing the marginal utility of work versus the marginal utility of leisure. As a college student, you are familiar with having many demands made on your time. More work means more money but less time for leisure, and vice versa. Marginal utility theory helps us to identify that point at which work and leisure (and hopefully study) balance out.
Although marginal utility theory is an elegant and logically consistent theory that helps us to understand how consumers behave, it does have some limitations. First, it assumes that consumers are able to measure the utility they derive from various sorts of consumption. Yet, this is virtually impossible in everyday life—
Others have argued that it is absurd to think that we could carry out the mental calculus required to compare the ratios of marginal utility to price for all possible goods and services. This is no doubt true, but even if we do not compare all possible goods and services in this way, we do draw some comparisons. After all, we somehow need to be able to distinguish between the desirability of going to a movie or going to a concert, because we cannot do both at the same time. Marginal utility theory is still a good way of approaching this choice, in a general way.
Lastly, marginal utility analysis has been criticized for not fully explaining why individuals sometimes act irrationally, at least according to what economic models predict. Indeed, human psychology often plays games with rational thinking, leading individuals to make decisions that would seem to go against the goal of maximizing utility. This topic of behavioral economics, which studies how human psychology enters into economic behavior, is one that has become increasingly popular among economists in recent decades, and is the focus of the next section.
CHECKPOINT
MARGINAL UTILITY ANALYSIS
Utility is a hypothetical measure of consumer satisfaction.
Total utility is the total satisfaction a person obtains from consuming a specific amount of goods.
Marginal utility is the additional satisfaction a consumer obtains from consuming one more unit of a good or service.
The law of diminishing marginal utility states that as consumption of a specific good increases, the increase in total satisfaction will decline.
Consumers maximize satisfaction by purchasing goods up to the point at which the marginal utility per dollar is equal for all goods.
Demand curves for products can be derived from marginal utility analysis by changing the price of one good and plotting the resulting changes in consumption.
QUESTIONS: Even though convenience stores have significantly higher prices than normal grocery stores such as Safeway, they seem to do well, judging by their numbers. Why are people willing to pay these higher prices? If a Safeway began to operate 24/7, how would this affect the sales of a nearby convenience store?
Answers to the Checkpoint questions can be found at the end of this chapter.
Convenience stores offer a small set of products at high prices nearer to home and have extended hours of operation. They also provide quicker service in that customers are in and out of the store quickly with their purchase. The marginal utility of convenience overcomes the higher prices; thus, people shop there because time is money. A 24/7 Safeway would have an impact on convenience store sales. At off-