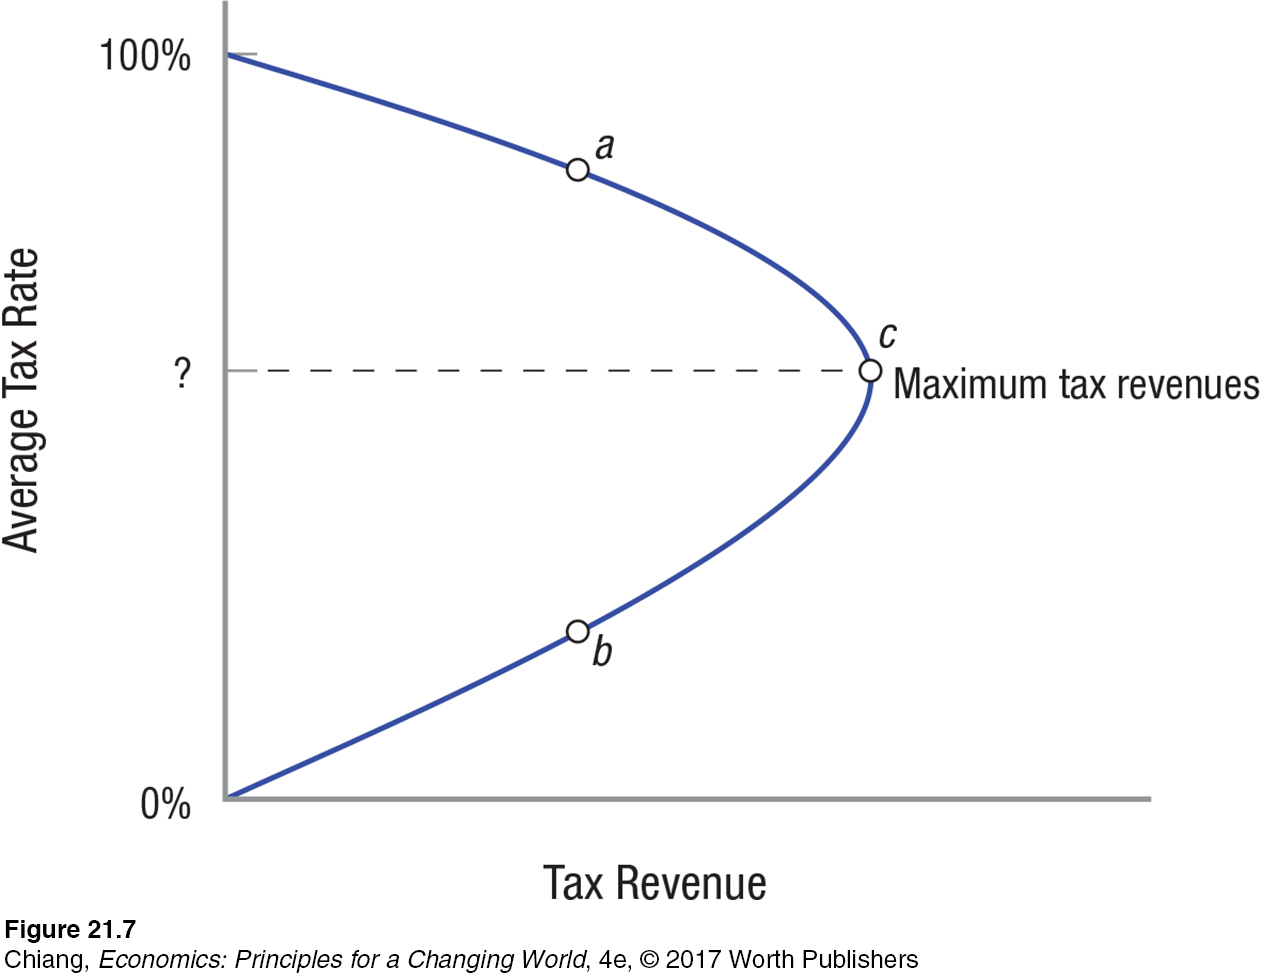
FIGURE 7 THE LAFFER CURVE
 The Laffer curve shows the relationship between average tax rates and total tax revenues. As the tax rate rises from 0%, tax revenues increase. At point c, tax revenues are maximized. If tax rates continue to rise, tax revenues will decrease because higher tax rates discourage people from working and firms from producing. A government collects the same tax revenues at points a or b. The tax rates that correspond to points b and c are often debated by economists.
