FIGURE APX- 1 DERIVING THE AGGREGATE DEMAND CURVE
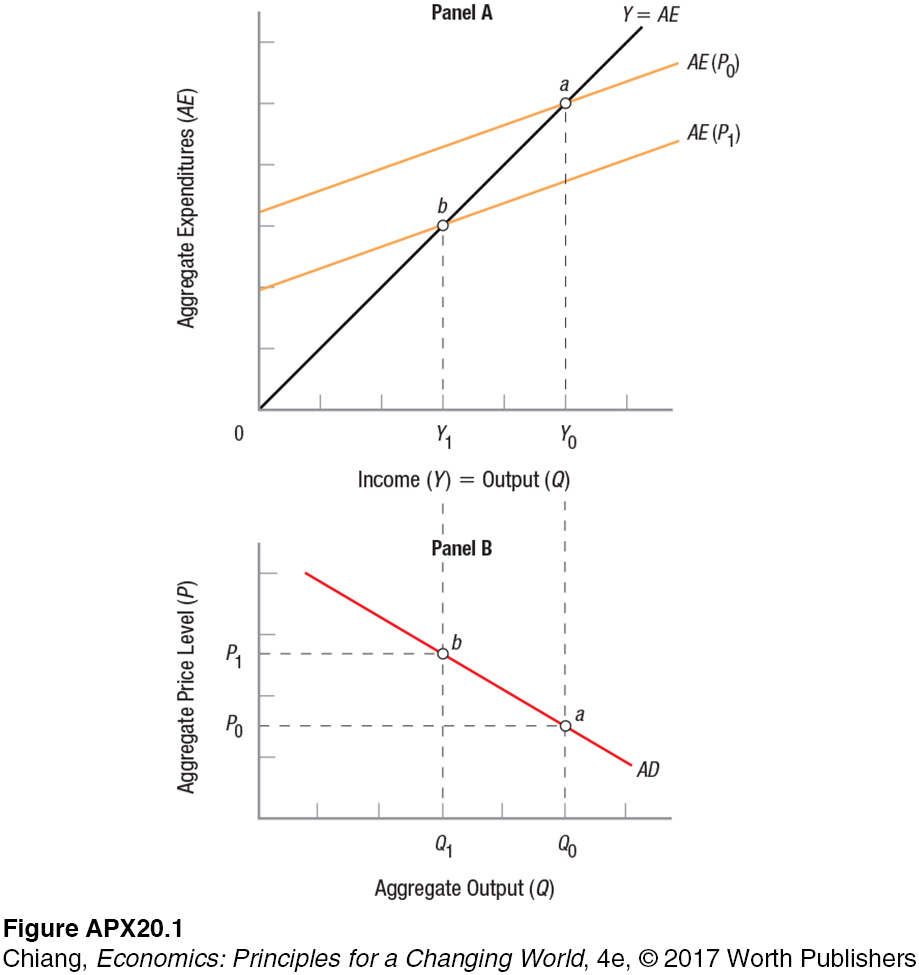 The aggregate demand curve, which shows the quantities of goods and services demanded at different price levels for the entire economy, can be derived using the aggregate spending model. Panel A shows aggregate expenditures curves at two different price levels. Point a on aggregate expenditures curve AE(P0) represents equilibrium income Y0, equivalent to a real output of Q0. Point a in panel B shows real output of Q0 that is associated with equilibrium point a and its price level P0. If the aggregate price level rises to P1, aggregate spending will decline to AE(P1) in panel A. The result is a new equilibrium at point b in both panels. Connecting points a and b in panel B results in aggregate demand curve AD.
[Leave] [Close]