QUESTIONS AND PROBLEMS
Check Your Understanding
Question 3.1
1. Product prices give consumers and businesses a lot of information besides just the price. What kinds of information?
Question 3.2
2. Name and explain the determinants of demand. Why are they important?
Question 3.3
3. Assume there is a positive relationship between aging and cholesterol levels. As the world population ages, will the demand for cholesterol drugs increase, decrease, or remain the same? Would this cause a change in demand or a change in quantity demanded?
Question 3.4
4. Describe some of the reasons why supply changes. Improved technology typically results in lower prices for most products. Why do you think this is true? Describe the difference between a change in supply and a change in quantity supplied.
Question 3.5
5. If a strong economic recovery boosts average incomes, what would happen to the equilibrium price and quantity for a normal good? How about for an inferior good?
Question 3.6
6. Suppose the market for tomatoes is in equilibrium, and events occur that simultaneously shift both the demand and supply curves to the right. Is it possible to determine how the equilibrium price and/or quantity would change? Explain.
Apply the Concepts
Question 3.7
7. Demand for tickets to sporting events such as the Super Bowl has increased. Has supply increased? What does the answer to this tell you about the price of these tickets compared to prices a few years ago?
Question 3.8
8. Suppose the price of monthly data plans required to access the Internet anywhere using a tablet computer falls. How would this affect the market for tablet computers?
Question 3.9
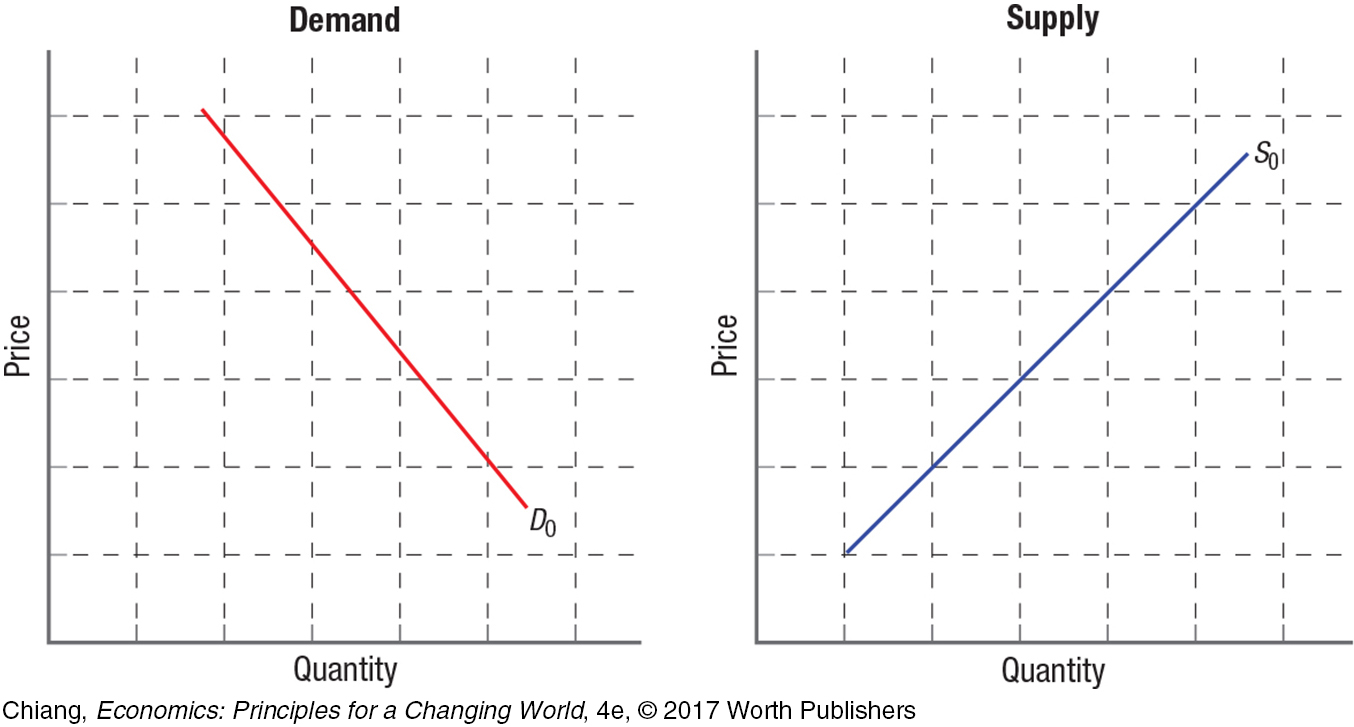
9. Using the figures on the accompanying page, answer the following questions:
On the Demand panel:
Show an increase in demand and label it D1.
Show a decrease in demand and label it D2.
Show an increase in quantity demanded.
Show a decrease in quantity demanded.
What causes demand to change?
What causes quantity demanded to change?
On the Supply panel:
Show an increase in supply and label it S1.
Show a decrease in supply and label it S2.
Page 79Show an increase in quantity supplied.
Show a decrease in quantity supplied.
What causes supply to change?
What causes quantity supplied to change?
Question 3.10
10. Several medical studies have shown that drinking red wine in moderation is good for the heart. How would such a study affect the public’s demand for wine? Would it have an impact on the type of grapes planted in new vineyards?
Question 3.11
11. Assume initially that the demand and supply for premium coffees (one-
Question 3.12
12. Over the past decade, cruise ship companies have dramatically increased the number of mega-
In the News
Question 3.13
13. In 2015 Google’s Self-
Question 3.14
14. When the Segway was unveiled in 2001, many believed it would become the future of transportation, replacing bicycles and even cars. Yet this expensive, bulky device never quite took off other than those used in Segway tours offered in many cities and by security officers in malls and airports. A decade later, other companies began developing newer, lighter, and less expensive motorized transportation devices such as the IO Hawk. A February 23, 2015, online article by Oxy.com, “This Motorized Skateboard Might Kick Segway to the Curb,” suggests that Segways may become obsolete. Using a demand and supply diagram for Segways, show the effect of the introduction of the IO Hawk on the market for Segways. Based on the article, are Segways and IO Hawks substitutes or complements?
Solving Problems
WORK IT OUT  | interactive activity
Question 3.15
15. A popular tradition when traveling to Hawaii is to receive a lei, a wreath of flowers to welcome guests. Although a lei can be made of flowers, leaves, nuts, or even candy and money, orchids remain the most popular flower used to create them. Suppose that supply and demand in the orchid lei market in Hawaii are as represented in the table below:
| Price ($/unit) | Quantity Demanded (thousands) | Quantity Supplied (thousands) |
|---|---|---|
| 5 | 24 | 8 |
| 10 | 20 | 12 |
| 15 | 16 | 16 |
| 20 | 12 | 20 |
| 25 | 8 | 24 |
Graph both the supply (S0) and demand (D0) curves. What is the current equilibrium price? Label that point a.
Assume that the Hawaiian lei industry increases its use of orchids from Thailand (where they are grown at a lower price), allowing orchid lei supply to increase by 8,000 units at every price. Illustrate the increase in the supply in your graph. Label the new supply curve (S1). What will the new equilibrium price in the market be? Label that point b.
Now assume that luxury hotels in Hawaii begin cost-
cutting measures by no longer presenting guests with a lei upon check- in, reducing orchid lei demand by 8,000 units at every price. Label the new demand curve (D1). What will the new equilibrium price be? Label this new equilibrium point c. Subsequently assume that severe monsoons and civil unrest in Thailand lead to a reduction in orchid production, reducing supply back to the original curve (S0). What will the new equilibrium price be? Label this new equilibrium point d.
Question 3.16
16. The following figure shows the supply and demand for strawberries. Answer the questions that follow.
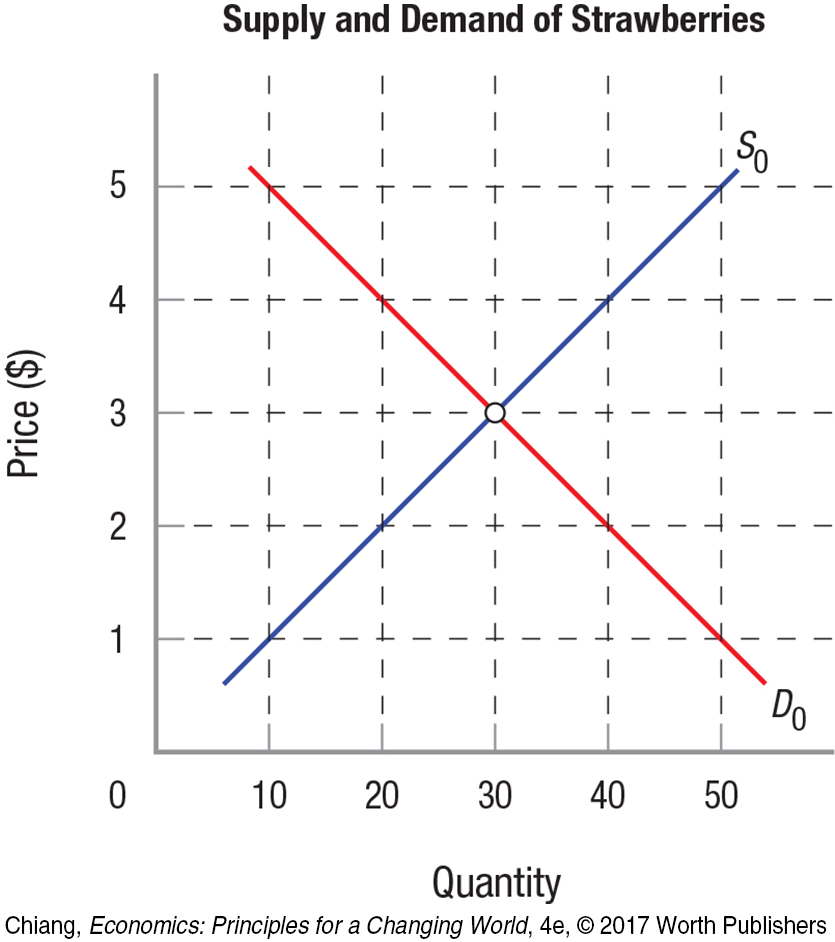
Indicate the equilibrium price and equilibrium quantity.
Suppose sellers try to sell strawberries at $4. How much of a shortage or a surplus of strawberries would result?
Page 81Now suppose that the demand for strawberries falls by 10 units at every price. Draw the new demand curve in the figure, and estimate what the new equilibrium price and equilibrium quantity would be.
If sellers still try to sell strawberries at $4, would the shortage or the surplus increase or decrease?
 USING THE NUMBERS
Question 3.17
17. According to By the Numbers, about how many times larger is the bottled water market in the United States in the year 2014 compared to 1984?
Question 3.18
18. According to By the Numbers, in which 6-