BUSINESS CYCLES
business cycles Alternating increases and decreases in economic activity that are typically punctuated by periods of recession and recovery.
Macroeconomics is concerned with business cycles, those short-
Defining Business Cycles
Business cycles are defined as alternating increases and decreases in economic activity. As economists Arthur Burns and Wesley Mitchell wrote,
Business cycles are a type of fluctuation found in the aggregate economic activity of nations that organize their work mainly in business enterprises: a cycle consists of expansions occurring at about the same time in many economic activities, followed by similarly general recession, contractions and revivals which merge into the expansion phase of the next cycle.1
1 Arthur Burns and Wesley Mitchell, Measuring Business Cycles (New York: National Bureau of Economic Research), 1946, p. 3.
Figure 2 shows the four phases of the business cycle. These phases, around an upward trend, include the peak (sometimes called a boom), followed by a recession (often referred to as a downturn or contraction), leading to the trough or bottom of the cycle, finally followed by a recovery or an expansion to another peak.
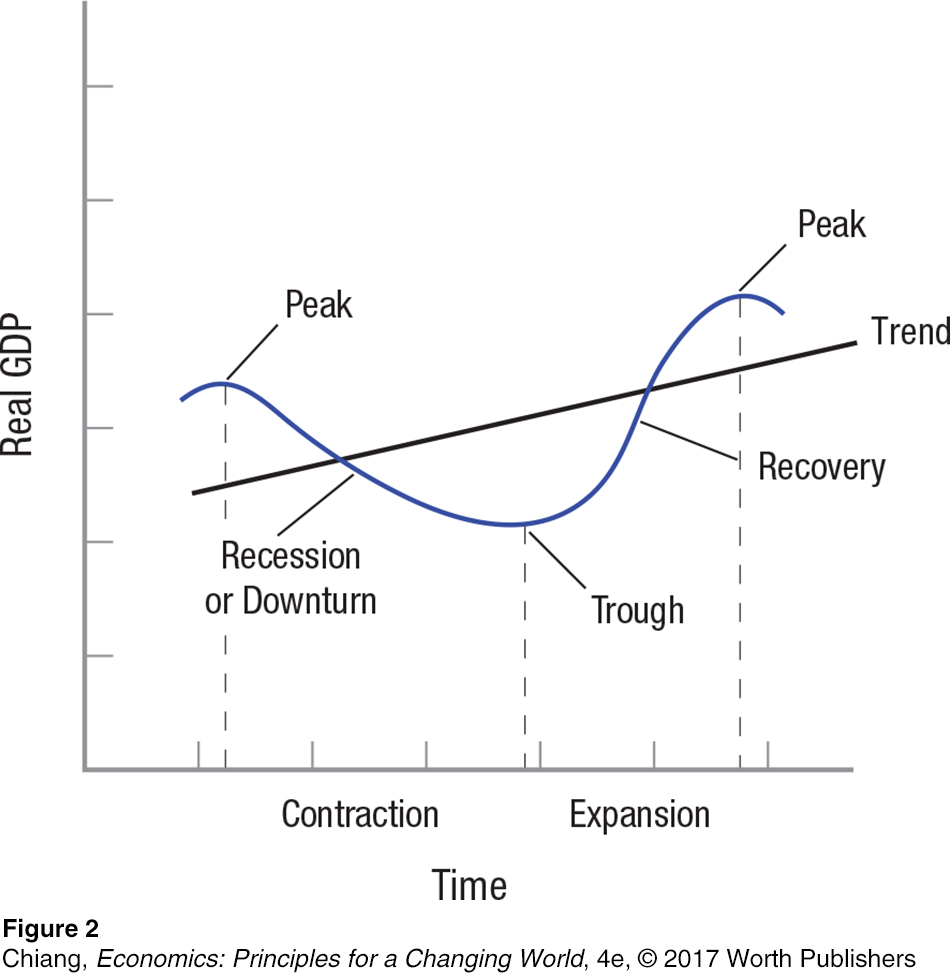
A peak in the business cycle usually means that the economy is operating at its capacity. Peaks are followed by downturns or recessions. This change can happen simply because the boom runs out of steam and business investment begins to decline, causing economic growth to slow or turn negative.
Once a recession is under way, businesses react by curtailing hiring and perhaps even laying off workers, thus adding to the recession’s depth. Eventually, however, a trough is reached, and economic activity begins to pick up as businesses and consumers become more optimistic about the economy. Often, the federal government or the Federal Reserve Bank institutes fiscal or monetary policies to help reverse the recession. We will look at government actions in future chapters.
Figure 2 suggests that business cycles are fairly regular, but in fact the various phases of the cycle can vary dramatically in duration and intensity. As Table 1 shows, the recessions of the last 65 years have lasted anywhere from 6 months to 18 months. Expansions or recoveries have varied even more, lasting from 1 year to as many as 10 years. Some recessions, moreover, have been truly intense, bringing about major declines in income, while others have been little more than potholes in the road, causing no declines in real income.
| TABLE 1 | SELECTED DATA FOR U.S. BUSINESS CYCLES SINCE 1950 | |||||
| Years | Peak | Trough | Recession Length (months) | Expansion Length (months) | Percentage Change in Real GDP | Maximum Unemployment Rate (%) |
| 1953– |
July 1953 | May 1954 | 10 | 39 | –2.2 | 5.9 |
| 1957– |
Aug. 1957 | April 1958 | 8 | 24 | –3.6 | 7.4 |
| 1960– |
April 1960 | Feb. 1961 | 10 | 106 | –0.6 | 7.1 |
| 1969– |
Dec. 1969 | Nov. 1970 | 11 | 36 | +0.2 | 6.1 |
| 1973– |
Nov. 1973 | March 1975 | 16 | 58 | –1.8 | 9.0 |
| 1980 | Jan. 1980 | July 1980 | 6 | 12 | –2.3 | 7.8 |
| 1981– |
July 1981 | Nov. 1982 | 16 | 92 | –2.2 | 10.8 |
| 1990– |
July 1990 | March 1991 | 8 | 120 | –1.0 | 6.9 |
| 2001 | March 2001 | Nov. 2001 | 8 | 73 | +0.5 | 5.8 |
| 2007– |
Dec. 2007 | June 2009 | 18 | — | –4.1 | 10.0 |

A good metaphor for the wide variation in business cycles is a roller coaster. Some roller coasters rise higher than others, fall faster than others, or climb slower than others. Some roller coasters have one large dip followed by a series of smaller ups and downs, while others may have a large dip followed by another large dip. This is true with business cycles—
double-
Unemployment has shown a similar variability: The more severe the recession, the higher the unemployment rate goes. In the recessions of 1990–
Dating Business Cycles
Business cycles are officially dated by the National Bureau of Economic Research (NBER), a nonprofit research organization founded in 1920. The NBER assigns a committee of economists the task of dating “turning points”—times at which the economy switches from peak to downturn or from trough to recovery. The committee looks for clusters of aggregate data pointing either up or down. Committee members date turning points when they reach a consensus that the economy has switched directions.
The committee’s work has met with some criticism because the decisions rest on the consensus of six eminent economists, who often bring different methodologies to the table. The committee’s deliberations, moreover, are not public; the committee announces only its final decision. Finally, the NBER dates peaks and troughs only after the fact: Their decisions appear several months after the turning points have been reached.2 By waiting, the panel can use updated or revised data to avoid premature judgments. But some argue that the long lag renders the NBER’s decisions less useful to policymakers.
2 Marcelle Chauvet and Jeremy Piger, “Identifying Business Cycle Turning Points in Real Time,” Review (St. Louis: The Federal Reserve Bank of St. Louis), March/April 2003, pp. 47–
Nonetheless, the work of the NBER in dating the turning points is important for investors and businesses alike, as they help form expectations of how the economy might perform based on the phase of the business cycle it has reached. Businesses are more likely to invest during a time of expansion, and they don’t want to be investing in greater production capacity at a time of recession when sales might fall.
Alternative Measures of the Business Cycle
Because the NBER focuses on historical data to date phases of the business cycle after they occur, economists have developed tools to analyze trends in an effort to predict phases of the business cycle before they occur. The following are three examples of methods used to predict business cycle movements.
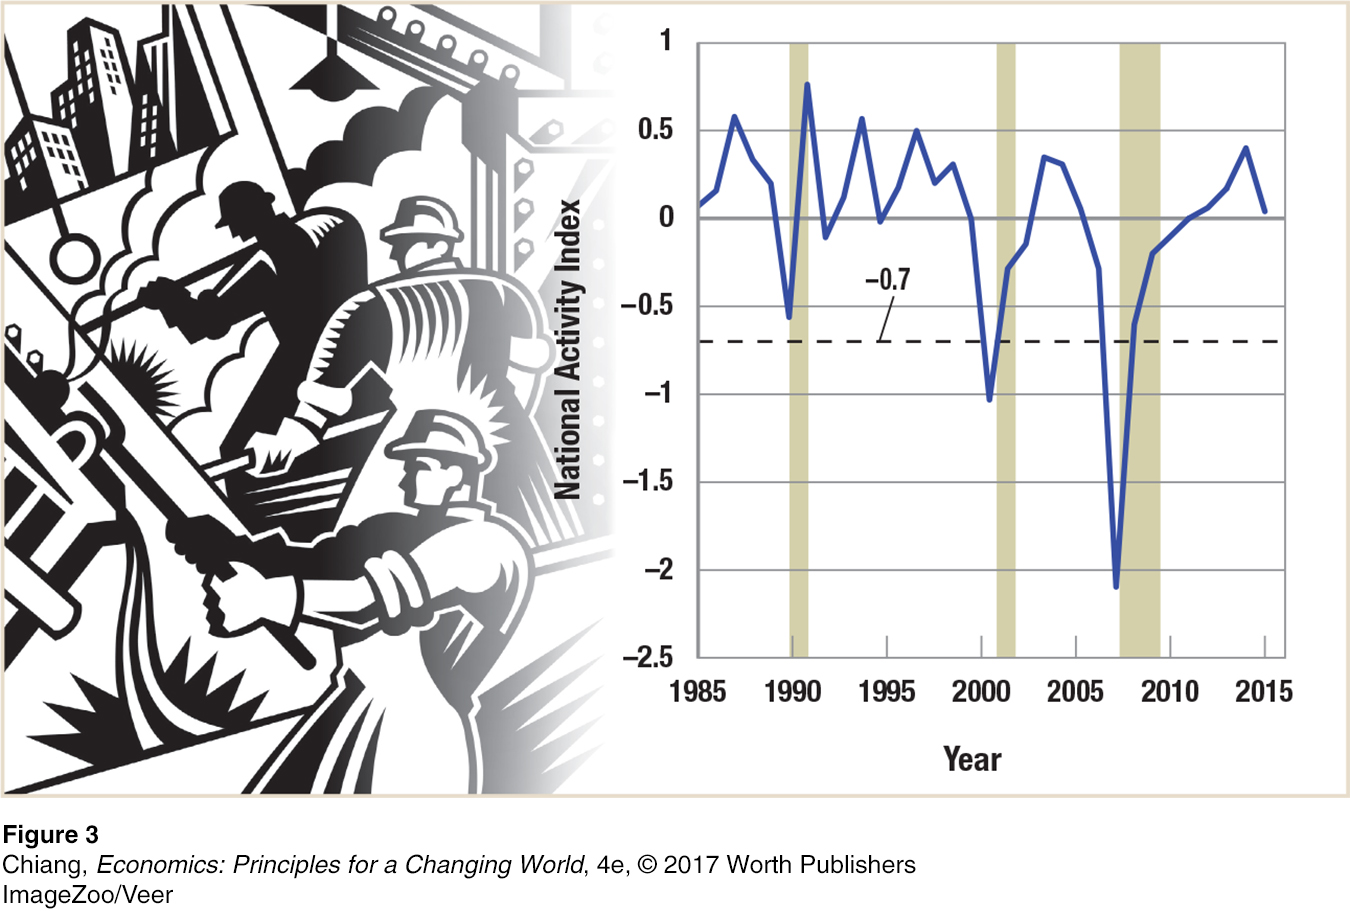
National Activity Index The National Activity Index, developed by the Federal Reserve Bank of Chicago, is a weighted average of 85 indicators of national economic activity. These indicators are drawn from a huge swath of economic activity including production, income, employment, unemployment, hours worked, personal consumption, housing, sales, orders, and inventories.
Figure 3 shows the index since 1985. When the index has a zero value, the economy is growing at its historical trend rate of growth. Negative values mean that the economy is growing slower and positive rates imply it’s growing faster than its long-
Leading Economic Index The Leading Economic Index (or LEI) established by The Conference Board, an independent business and research association, is another index that economists look to when predicting movements in the business cycle. The LEI uses ten important leading indicators to produce a weighted index. Because each indicator is a predictor of how the economy should perform in the near future, any change in the LEI today is supposed to reflect how the economy will change tomorrow.
Indicators in the LEI
Average weekly hours, manufacturing
Average weekly initial claims for unemployment insurance
Manufacturers’ new orders, consumer goods and materials
Index of supplier deliveries—
Manufacturers’ new orders, nondefense capital goods
Building permits, new private housing units
Stock prices, 500 common stocks
Money supply, M2
Interest rate spread, ten-
Index of consumer expectations
The LEI predicts a recession whenever the index falls for three months in a row (compared to the same month the previous year). In fact, it has successfully predicted the last seven recessions since 1969, although critics point to the fact that it has also provided some false warnings of recessions (a funny adage shared among economists is that forecasters have predicted ten of the last seven recessions).
yield curve Shows the relationship between the interest rate earned on a bond (measured on the vertical axis) and the length of time until the bond’s maturity date (shown on the horizontal axis).
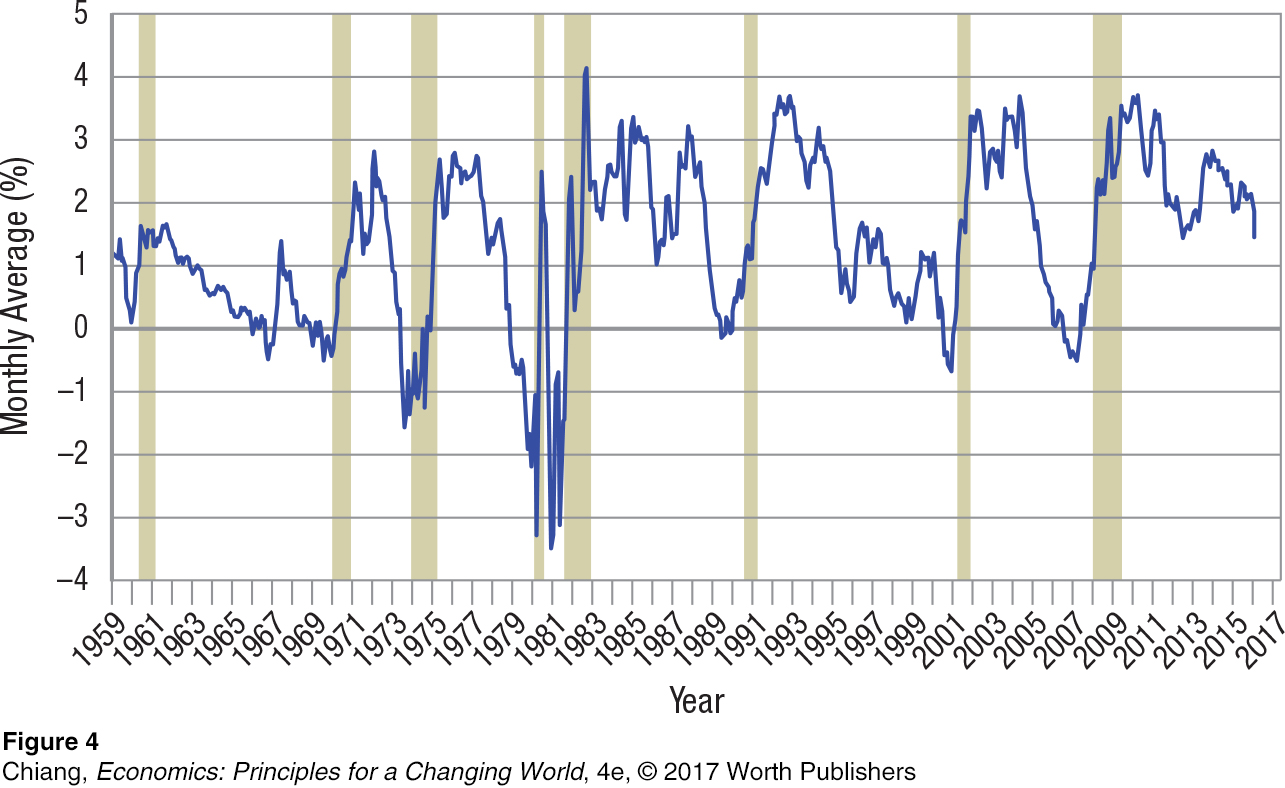
Yield Curve Perhaps the simplest, and surprisingly accurate, predictor of changes in the business cycle is the yield curve. A yield curve shows the interest rates for bonds (shown on the vertical axis) with different maturity rates (shown on the horizontal axis). For example, it would show the difference in interest rates between a three-
One approach economists have used to predict recessions, shown in Figure 4, is to take the interest rate of a long-
ISSUE
The End of the Recession . . . It Does Not Feel Like It
According to the National Bureau of Economic Research, the last U.S. recession officially ended in June 2009. But ask most people (besides economists) at the time or even a year later whether they thought the recession was over and you would have likely been laughed at. Indeed, in June 2009, the economy was not in good shape: The unemployment rate was 9.5%, GDP was over 4% below its peak, and the stock market was nearly 40% below its high two years prior. Why would such dismal economic conditions signal the end of the recession?
Part of the explanation is how economists date the business cycle. The NBER looks at “turning points” when the economy goes from a peak to a downturn or from a trough to a recovery. A recession officially ends when the economy is at the trough, which occurs when the economy is at its worst (or near worst) condition. In fact, the NBER generally waits until evidence of two quarters of GDP growth is found before declaring the recession over. Therefore, some recovery may already have occurred when a recession ends.
Looking at the lives of everyday people, the beginning of a recovery is sometimes a more difficult time to live through than the recession itself. This brings about the other part of the explanation—
To many people, life at the start of a recession was much better than life at the start of the recovery. In fact, the 2007–

In sum, how economists date recessions and recoveries is based largely on the turning points of the business cycle, which may not always reflect what everyday people experience.
| Start of Recession (December 2007) | Start of Recovery (June 2009) |
| Unemployment Rate = 5.0% | Unemployment Rate = 9.5% |
| GDP (2005 dollars) = $13.4 trillion | GDP (2005 dollars) = $12.8 trillion |
| Stock Market (Dow) = 13,500 | Stock Market (Dow) = 8,800 |
| Middle of Recession (September 2008) | Two Years of Recovery (June 2011) |
| Unemployment Rate = 6.2% | Unemployment Rate = 9.1% |
| GDP (2005 dollars) = $13.2 trillion | GDP (2005 dollars) = $13.4 trillion |
| Stock Market (Dow) = 11,200 | Stock Market (Dow) = 12,000 |
Each of the three indices is one of many methods economists use to predict the movements of the business cycle. Although a perfect predictor of booms and busts is not possible, many people follow these indices because of the importance of the business cycle in the macroeconomy.
The duration and intensity of business cycles are measured using data collected by the Bureau of Economic Analysis and U.S. Department of Labor. These data for aggregate income and output come from the national income and product accounts. We turn in a moment to see how these data are collected and analyzed and consider how well they measure our standard of living. Keep in mind that these data are the key ingredients economists use to determine the state of the macroeconomy.
CHECKPOINT
BUSINESS CYCLES
Business cycles are alternating increases and decreases in economic activity.
The four phases of the business cycle include the peak, recession (or contraction), trough, and recovery (or expansion).
Business cycles vary in intensity, duration, and speed.
Business cycles are dated by the National Bureau of Economic Research (NBER). Business cycles are usually dated some time after the trough and peak have been reached.
Economists have developed different methods to predict movements in the business cycle, including the use of the National Activity Index, the Leading Economic Index, and the yield curve.
QUESTION: Do you think that the business cycle has a bigger impact on automobile and capital goods manufacturers or on grocery stores?
Answers to the Checkpoint questions can be found at the end of this chapter.
Big-