GDP AND OUR STANDARD OF LIVING
GDP data provide us with one way of comparing the productivity of different nations. But it doesn’t necessarily give us an accurate picture of the standard of living in each country. For example, China, India, and Brazil each have a GDP that places them among the top ten largest economies in the world. But clearly one would not describe the average citizen in these countries as wealthy. This section describes some of the factors that make it challenging to use GDP measures to compare the standard of living of average citizens across countries.
Different Ways of Comparing GDP Across Countries
The previous section described the two ways of measuring GDP using total expenditures and total income in an economy. But once the value of GDP is determined, does that mean it can be used to compare the size of the overall economy between two countries? To some extent, yes, in that countries with larger GDP do produce more output based on the final value of goods and services in that country and in a particular year. Herein lies an important caveat regarding GDP measures: Nominal GDP statistics do not do a good job of factoring changes in the prices of goods and services over time, nor taking into account differences in the cost of living between countries.
real GDP The total value of final goods and services produced in a country in a year measured using prices in a base year.
To address the first issue of changing prices, the U.S. Bureau of Economic Analysis reports GDP statistics in both nominal terms as well as in real terms. Real GDP statistics adjust each year’s data to prices in a single base year (such as 2005). Therefore, real GDP does a better job of measuring actual growth in output, rather than counting the rise in prices of goods and services over time. The next chapter on inflation discusses nominal and real values in greater detail.
To address the second issue of differences in the cost of living between countries, organizations that report GDP statistics across countries, such as the World Bank’s World Development Indicators, also report GDP statistics based on purchasing-
The effect of using GDP-
Population and GDP per Capita
GDP per capita A country’s GDP divided by its population. GDP per capita provides a useful measure of a country’s relative standard of living.
How can GDP measures better reflect a country’s population? The most common approach is to divide GDP by a country’s population, resulting in a statistic known as GDP per capita. GDP per capita is a useful measure of the relative standard of living of citizens in different countries. However, by simply dividing GDP by population, GDP per capita does not take into account the differences in wealth between the rich and poor within a country, and therefore might not fully reflect the standard of living of the typical citizen. For example, U.S. GDP per capita is about $55,000, but certainly the typical American family of four does not earn $220,000 a year. Yet, GDP per capita data are fairly easy to measure, and thus are a useful measure of relative wealth between countries.
An alternative measure of the standard of living is median household income. Being the median household means that half of all households make less and the other half make more. Using this statistic reduces the effect of outliers (i.e., the very destitute or the superrich) skewing the averages. The U.S. median household income in 2016 was about $57,000, an amount that is closer to what middle-
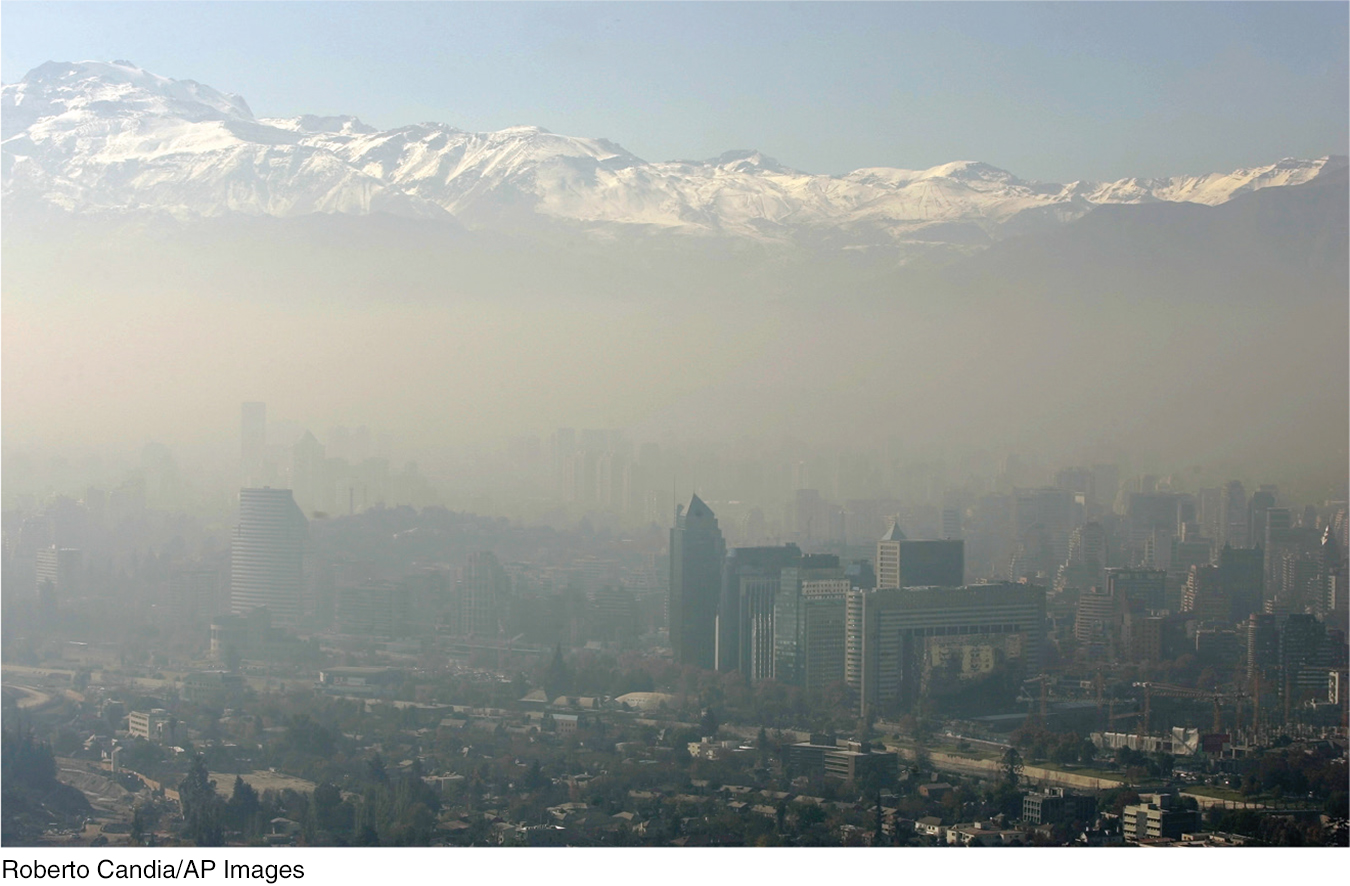
Environmental Quality
People around the globe have become increasingly concerned with the impact economic activity has on the natural world. These days, it is difficult to watch a nightly newscast without seeing a report about some ecological disaster or looming environmental problem. U.S. consumers, businesses, and the government spend hundreds of billions of dollars annually to protect the environment at home and abroad. Surprisingly, however, our national income and production statistics do little to account for the environmental benefits or harmful impacts of economic activity.
Costa Rica: Pura Vida and Happiness Without a High Level of GDP
What does GDP fail to measure in terms of how well Costa Ricans live?
When one thinks of countries in which citizens live well, rich countries often come to mind, such as Luxembourg, Denmark, and Switzerland. These countries have a high GDP per capita, allowing many of their people to live comfortable, and consequently happy, lives. This contrasts with countries with low GDP per capita, such as Sudan, Bangladesh, or Chad, where many people lack basic necessities and where much suffering takes place.
But does a country need to be materially rich in order to be happy? One country in Central America whose name literally translates to “rich coast” doesn’t think so.
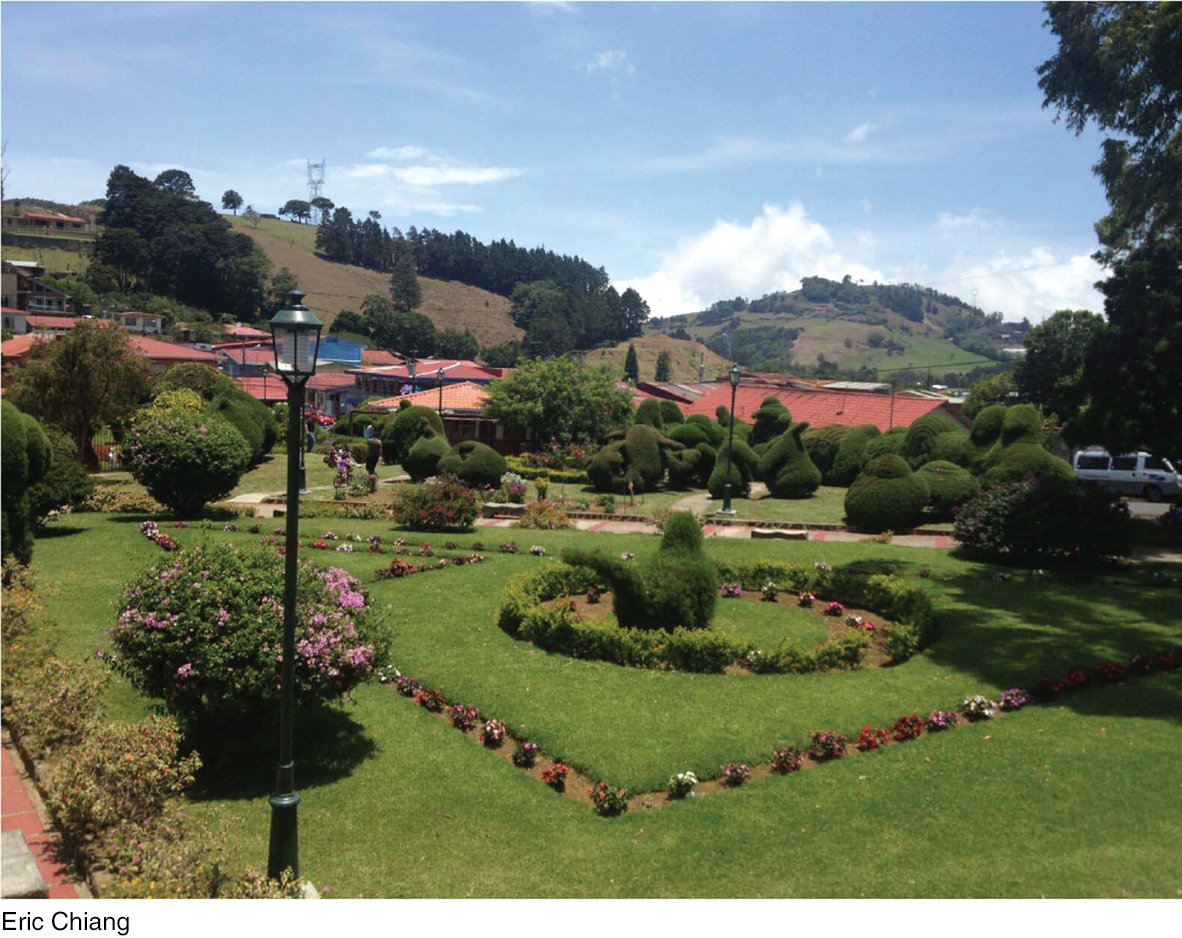
Costa Rica’s GDP per capita is about $10,000 a year, or one-
It’s no wonder why many companies including those in the United States choose to operate production facilities in Costa Rica. With a literacy rate near 100% and a healthy, long-
Still, low wages means that many families in Costa Rica struggle with daily finances and lack the ability to afford luxuries that richer countries take for granted. But Costa Ricans, in addition to their uplifting country name, also have an uplifting national slogan, “Pura Vida,” a phrase used in ordinary everyday conversations to express optimism about life. As long as people are happy, they live productive lives, which bodes well for the future of the country.
In 1992 the Bureau of Economic Analysis decided to develop an experimental set of economic accounts known as the Integrated Environmental and Economic Satellite Accounts. Preliminary versions of these green GDP accounts were published in 1994, and later Congress directed the DOC to set up an outside panel of experts to study this issue in greater depth. The DOC asked the National Academy of Sciences to look at green economic accounting, which it did, appointing a select panel.
The DOC panel concluded that “extending the U.S. NIPA to include assets and production activities associated with natural resources and the environment is an important goal.”4 In terms of natural resources, these include the flow of services that are produced by environmental capital such as forests, national parks, and ocean fisheries.
4 Nordhaus and Kokkelenberg, Nature’s Numbers, pp. 2–
But from a consumer’s perspective, a cleaner environment also provides value. The ability to hike in parks, to suntan on clean beaches, and to swim in lakes and rivers all depend on a level of environmental quality that does not show up in our national accounts.
Nonmarket Activities and the Informal Economy
In addition to addressing such concerns as environmental impacts and the value of nonmarket natural resources, the DOC panel’s recommendations highlight some of the broader shortcomings of the NIPA. For example, the national accounts ignore nonmarket transactions, investments in human capital, and the use of people’s time.
Nonmarket transactions are an important part of our everyday lives. If a maid cleans your apartment, GDP rises, but if you did the same job yourself, GDP is unaffected. The same is true for babysitting, lawn care, and car maintenance. There is one exception—
Many people believe that the NIPA should be an index of the well-
informal economy Includes all transactions that are conducted but are not licensed and/or generate income that is not reported to the government (for tax collection).
The informal economy (the underground or black market) is a large unmeasured component of our economy. The informal economy can be as simple as the money earned from a garage sale or from items sold on eBay that are not reported to the IRS. It also includes transactions dealing with illegal goods and services, such as drugs, prostitution, or unlicensed gambling. Finally, the informal economy includes the income earned by undocumented residents—
The effects of the informal economy can be positive and negative. On the upside, people working in the informal economy are generating and spending income, contributing to national economic activity. Countries with large informal markets have total output that is significantly larger than what is officially reported in their GDP statistics. On the downside, those working in the informal economy do not pay much if any taxes, placing a greater tax burden on the rest of society. Also, the informal economy is less regulated, which increases the probability of corruption and crime.
Despite these shortcomings in the NIPA measurements, it is important to keep the NIPA’s original purpose in mind. As the DOC panel noted,
The modern national income and product accounts are among the great inventions of the twentieth century. Among other things, they are used to judge economic performance over time, to compare the economies of different nations, to measure a nation’s saving and investment, and to track the business cycle. Much as satellites in space can show the weather across an entire continent, the national accounts can give an overall picture of the state of the economy.5
5 Nordhaus and Kokkelenberg, Nature’s Numbers, p. 12.

The NIPA has served us well. Still, making adjustments to account for various environmental and other nonmarket considerations might provide us with an even better picture of the health of our economy. But we must keep in mind that an aggregate measure of the economy cannot be all things to all people. As we add complexity to an already complex undertaking, the NIPA may lose some effectiveness as a measure of economic activity, as pointed out earlier in the discussion of environmental quality. This is a difficult balancing act facing policymakers.
The NIPA allow us to track business cycles, compare the domestic economy with that of other nations, and take a crude measure of our standard of living. In the next chapter, we will see how two other important policy variables, unemployment and inflation, are measured.
The next several chapters will focus on developing explanations of short-
CHECKPOINT
GDP AND OUR STANDARD OF LIVING
Nominal GDP uses current year prices, while real GDP measures output using prices from a base year. GDP-
PPP takes into account the cost of living in a country. GDP per capita divides GDP by population, providing a useful measure of a country’s relative standard of living.
GDP does not include most of the benefits and costs from environmental and natural resources.
GDP does not include nonmarket activities or the informal economy.
Despite the shortcomings of the GDP measure, GDP provides a simple and consistent way of measuring the overall economic activity in an economy.
QUESTIONS: Each summer, many of the campsites at America’s favorite national parks sell out months in advance due to their limited supply, low prices, and prime locations and views. This has led entrepreneurial individuals to reserve these campsites well in advance and then sell the reservations for a high premium on sites such as Craigslist. Does the money earned by these campsite scalpers appear in GDP? Why or why not? Suppose the government attempts to minimize campsite scalping by doubling the price of campsites. Would this affect GDP? Explain.
Answers to the Checkpoint questions can be found at the end of this chapter.
The money earned by the scalpers is not counted in GDP because scalpers are not likely to report this income on their tax returns, and thus this is considered part of the informal economy. The revenues earned by Craigslist, a legitimate enterprise, for the transaction would count toward GDP.
If the government doubles the price of campsites and they continue to sell out, then GDP would increase because money paid to the National Parks is part of consumption spending in GDP.