Economic Growth
7

Learning Objectives
7.1 Describe how economic growth is measured using real GDP and real GDP per capita.
7.2 Use the Rule of 70 to approximate the number of years it takes for an economy’s output to double in size.
7.3 Explain the power of compounding in making small differences much larger over time.
7.4 Explain the difference between short-
7.5 List the four factors of production and how each plays a role in the production function.
7.6 Discuss the factors that increase productivity and economic growth.
7.7 Explain total factor productivity and what it measures.
7.8 Explain how the government promotes economic growth through the provision of physical capital and the enhancement of human capital and technology.
7.9 Discuss how strong institutions and economic freedom facilitates economic growth.
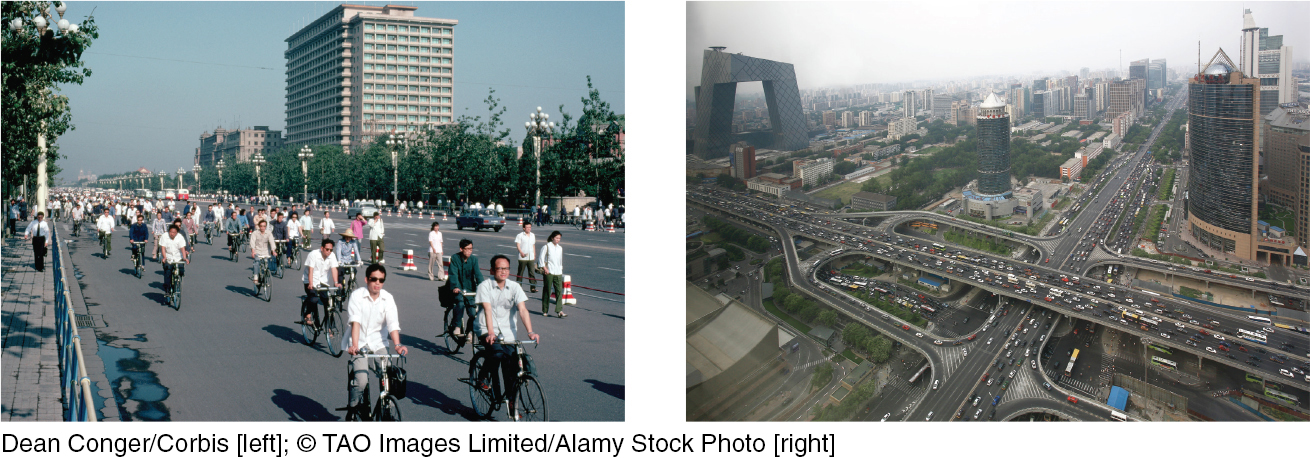
On a typical downtown street in Beijing in the 1980s, one would see thousands of bicycles and pedestrians among a trickling of cars owned by the privileged few. The skyline consisted of just a few large buildings.
How times have changed. Today, the bicycles in Beijing have largely been replaced with cars driven by millions of Chinese (now the world’s largest consumers of cars) whose incomes have increased enough to afford one, the skyline is dominated by modern skyscrapers, and the pedestrians have largely moved underground, traveling on one of the world’s most extensive and modern subway systems.
China’s transformation from a poor, agricultural nation to an emerging world power with a growing middle and upper class has been remarkable. China’s annual growth rate has averaged 9% over the past 20 years, compared to the average U.S. annual growth rate of 2% over the same period. Although a 7% difference might not seem significant, over 20 years the cumulative growth effect is staggering: China’s real GDP grew 521% from 1995 to 2015, while in the United States, real GDP grew 62%.
Economic growth plays a very powerful role in how people live and how standards of living change over time. Even small differences in growth rates turn into large differences in the long run.
One generation ago, the United States, Europe, and the East Asian economies of Japan, Singapore, South Korea, Taiwan, and Hong Kong were the leaders of economic growth. These countries had consistent, strong growth, while the rest of the world lagged behind.
Today, a much different picture emerges. Some developing countries are experiencing the highest rates of growth, while those in the developed world have seen slower growth rates, especially in the aftermath of the devastating financial crisis and recession of 2007–
During the 2000s, much of the world’s global economic growth was concentrated in the BRIC countries: Brazil, Russia, India, and China. These countries transformed from developing economies to more advanced economies, and by doing so achieved a remarkable feat: In 2015 all four countries were among the ten largest economies in the world, measured by GDP.

Chang’an Avenue, Beijing (2011)
© TAO Images Limited/Alamy Stock Photo
But rapid growth in any country cannot be maintained forever. Although India continued to maintain a high growth rate of over 7% in 2016, China’s economy has slowed in recent years, from an average annual growth rate of nearly 10% just a few years ago to less than 7% in 2016. Even worse, Russia’s and Brazil’s economy both entered into recessions in 2015—
Meanwhile, growth in the United States continues at a slow pace, averaging around 2% per year. Where, then, are today’s beacons of growth? They are concentrated in developing countries in Africa and Central/South Asia, including Ethiopia, Turkmenistan, Myanmar, and Ivory Coast, all of which are growing faster than China and India. This bodes well for bringing many more people out of poverty, just as the BRIC countries have done over the past decade.
This chapter focuses on long-