AGGREGATE DEMAND
aggregate demand The output of goods and services (real GDP) demanded at different price levels.
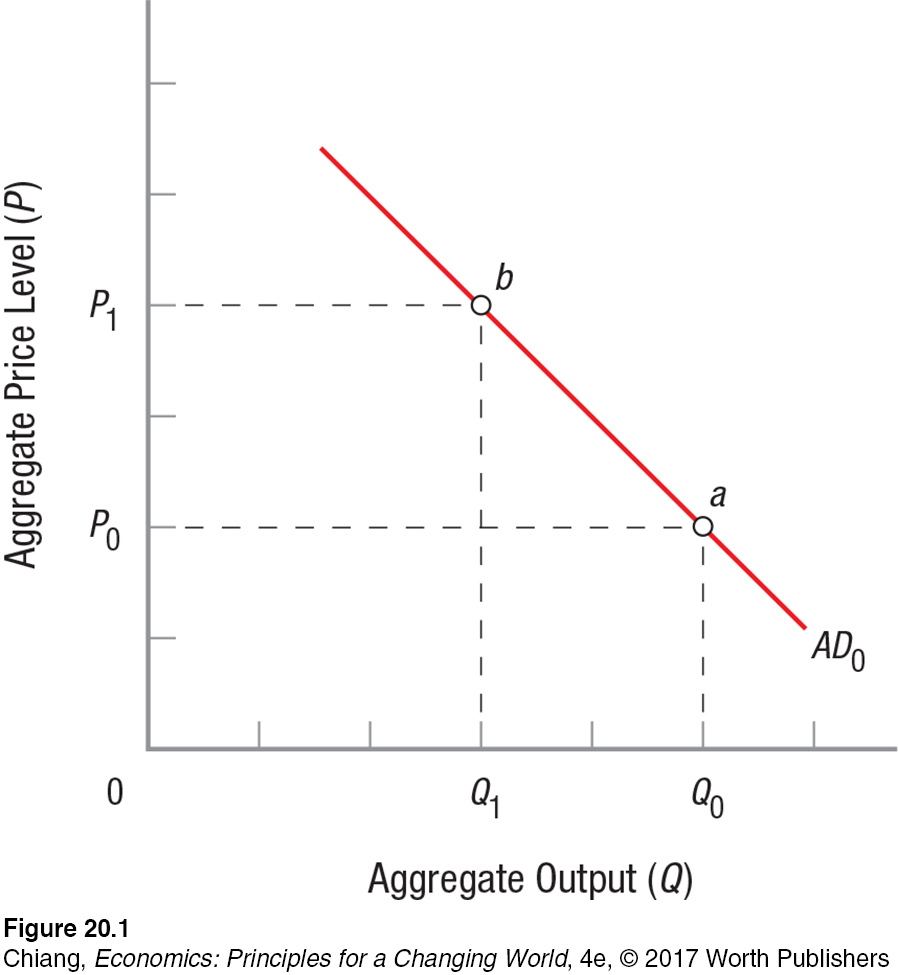
The aggregate demand (AD) curve (or schedule) shows the output of goods and services (real GDP) demanded at different price levels. The aggregate demand curve in Figure 1 looks like the product demand curves we studied earlier. They both slope downward, showing how output rises as prices fall, and vice versa. However, it’s important to remember that the reasons the product and aggregate demand curves slope downward are different.
Why Is the Aggregate Demand Curve Negatively Sloped?
Product demand curves slope downward due to income and substitution effects. An income effect occurs when the price of a given product falls, resulting in money being freed up, allowing consumers to afford more of all goods. A substitution effect occurs when the price of a product falls, causing consumers to purchase more of the product because they substitute it for other higher-
wealth effect Households usually hold some of their wealth in financial assets such as savings accounts, bonds, and cash, and a rising aggregate price level means that the purchasing power of this monetary wealth declines, reducing output demanded.
The Wealth Effect One reason that real output declines when the aggregate price level rises is the resulting reduction in household wealth, called the wealth effect. Households usually hold some of their wealth in financial assets such as savings accounts, bonds, and cash. A rising aggregate price level means that the purchasing power of this monetary wealth is declining. If, for example, you have $5,000 in a savings account and prices rise throughout the economy, that $5,000 will now purchase less than before. This reduction in household purchasing power means that some purchases are put on hold, thereby reducing output demanded. This is represented by a movement from point a to point b in Figure 1.
Export Price Effect When the U.S. aggregate price level rises, American goods become more expensive in the global marketplace. Higher prices mean that our goods are less competitive with the goods made in other countries. The result is that foreigners purchase fewer American products, and our exports decline. A decrease in exports means that the demand for domestically produced goods and services (the quantity purchased by foreign consumers, a component of real GDP) also declines. Therefore, higher prices result in lower real output.
Interest Rate Effect Interest rates are the prices paid for the use of money. If we assume for a moment that the quantity of money is fixed, then as aggregate prices rise, people will need more money to carry out their economic transactions. As people demand more money, the cost of borrowing money—
In summary, the aggregate demand curve is negatively sloped because of three factors. When the aggregate price level rises, this lowers household purchasing power because of the wealth effect. A rising aggregate price level also lowers the amount of exports because our goods are now more expensive. Furthermore, a rising aggregate price level increases the demand for money and therefore drives up interest rates. Rising interest rates reduce business investment and reduce the quantity demanded of real GDP. In each case, as aggregate prices rise from P0 to P1, quantity demanded of real GDP falls from Q0 to Q1.
Determinants of Aggregate Demand
We have seen that the aggregate demand curve is negatively sloped. Everything else held constant, a change in the aggregate price level will change the quantity of real GDP demanded along the aggregate demand curve. The determinants of aggregate demand are those factors that shift the entire aggregate demand curve when they change. They are the “everything else held constant.” These include the components of GDP: consumption, investment, government spending, and net exports.
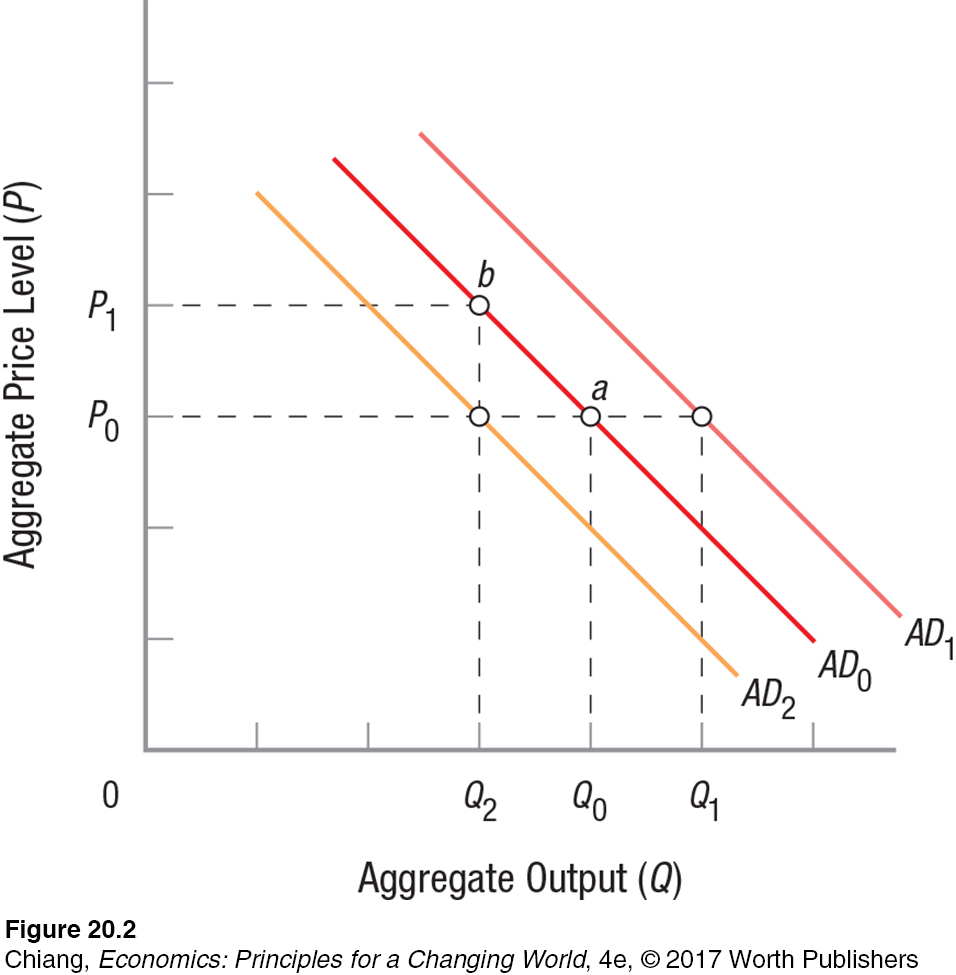
If one of these components of aggregate spending changes, the aggregate demand curve will shift, as shown in Figure 2. At first, aggregate demand is AD0; therefore, a shift to AD1 represents an increase in aggregate demand; more real output is demanded at the same price level, P0. If, for example, businesses decide to invest more in new technology, more real output is now demanded at the current price level, P0, and at all other price levels. For similar reasons, a decrease in aggregate demand to AD2 means that less real output is being demanded. If consumers fear the onset of a recession and decide to reduce spending to increase their savings, then less output will be demanded at all price levels.
Let’s look at these determinants of aggregate demand more closely. What might cause the various components of aggregate expenditures to change, shifting the AD curve?
Consumer Spending Consumer spending is the largest component of aggregate demand, representing about 68% of total spending in the economy. The level of spending as a percentage of overall output is relatively stable over time. Still, consumer spending is affected by several major factors: wealth, consumer confidence, household debt, interest rates, and taxes. Because consumer spending represents such a large part of the economy, even small changes in these factors can have a significant impact on the economy. And in times when consumption changes a lot, the effect on the economy can be dramatic.
For example, when home prices skyrocketed in the mid-
Note that changes in wealth have two similar but distinct impacts on aggregate demand. First, as described earlier, when aggregate prices rise, the purchasing power of financial assets falls, reducing the amount of goods and services that can now be purchased with this money. This is a movement along an existing aggregate demand curve to a higher price level (point a to b in Figure 2).
Second, described here, is a decrease in wealth (e.g., caused by a stock market crash) that reduces consumption at all price levels. In this case, the entire aggregate demand curve shifts from AD0 to AD2 in Figure 2. This is the impact of changing wealth on consumer spending that is usually the focus of attention by the media and policymakers.
Consumer expectations and confidence about the economy play a significant role in determining the level of consumer spending. High confidence in the economy eases job security fears and stimulates consumer spending, shifting the aggregate demand curve to the right. High family debt ratios restrict access to future credit, reducing spending on high-
Investment Investment (spending, mostly by businesses for structures, equipment, and software) is determined mainly by interest rates and the expected rate of return on capital projects. When interest rates rise, investment will fall and the aggregate demand curve will shift to the left, and vice versa.
When business expectations become more favorable—
Because investment decisions tend to be larger in magnitude than everyday consumption purchases, investment varies much more from year to year. Therefore, although investment represents a smaller percentage of aggregate demand, its relative instability can result in a significant effect on the aggregate economy.

Government Spending and Net Exports Government spending and net exports have essentially the same effect on the aggregate economy as consumer and investment spending. When government spending or net exports rise, aggregate demand increases, and vice versa.
When the national income of a foreign country rises, some of this money is used to buy more American goods and services. The increase in demand for U.S. goods and services in other countries results in more exports, which increases U.S. aggregate demand. A change in foreign exchange rates will also affect aggregate demand. An appreciation, or rise, in the value of the euro, for instance, will result in Europeans buying more American goods because a euro will buy more. Again, this change increases U.S. exports and U.S. aggregate demand. These effects on aggregate demand are offset by increases in imports of foreign goods, because goods are being demanded from outside of the United States.
A quick summary is now in order. The aggregate demand curve shows the quantities of real GDP demanded at different price levels. (The derivation of the AD curve using the Keynesian fixed price model is shown in the Appendix to this chapter.) The aggregate demand curve slopes downward because of the wealth effect (the value of monetary assets falls when the price level rises), because exports fall as domestic prices rise, and because rising prices raise interest rates, which reduce investment. On the other hand, changes in one of the determinants of aggregate demand shift the aggregate demand curve. Table 1 summarizes the determinants of aggregate demand.
| TABLE 1 | THE DETERMINANTS OF AGGREGATE DEMAND (THE AGGREGATE DEMAND CURVE SHIFTS WHEN THESE CHANGE) | |||||
| Determinant | AD Increases | AD Decreases | ||||
| Consumer Spending | ||||||
|
Wealth increases | Wealth decreases | ||||
|
Expectations improve | Expectations worsen | ||||
|
Debt falls | Debt rises | ||||
|
Lower | Higher | ||||
|
Taxes are cut | Taxes increase | ||||
| Investment | ||||||
|
Lower | Higher | ||||
|
Higher | Lower | ||||
|
More positive | More negative | ||||
|
Taxes are cut | Taxes increase | ||||
| Government Spending | Increase | Decrease | ||||
| Net Exports | ||||||
|
Rising | Falling | ||||
|
Depreciating dollar | Appreciating dollar | ||||
Again, the determinants of aggregate demand are those “other factors held constant”: consumption, investment, government spending, and net exports. If one of those determinants changes, the entire aggregate demand curve will shift. Keep in mind that changes in the determinants are most important for policymaking. When a policy is enacted (say, lower tax rates), policymakers expect to stimulate consumer and investment spending, increasing aggregate demand, output, and employment.

Myanmar: Opening a Country to a Boom in Aggregate Demand
How did Myanmar’s transition from an authoritarian regime to a democracy lead to an increase in aggregate demand?
For many nations in Asia and Africa that had been colonized by Europeans in the 19th and 20th centuries, a cultural clash existed between the rich histories of the native inhabitants and the modern influences that were brought by the colonizers. When many of these countries (including major countries such as India and Vietnam) achieved independence in the mid-

What happened in Myanmar since 2012 that has resulted in a significant increase in aggregate demand?
Myanmar (formerly Burma) achieved its independence from the British in 1948, but the transition process was not smooth, as various political organizations (each supported by a segment of the military) competed for power. This culminated in 1962 with a strict authoritarian regime led by a series of political parties that ruled by force. It would take another 50 years before Myanmar held its first democratic elections.
Since 2012 foreign investment has entered the country of 53 million, welcomed by a labor force eager to work, even at low wages, for a chance at a better life. The improved employment picture led to increased consumption, and subsequently the opening of new markets and service industries.
Then, a very significant change occurred: The re-
Each of these events, which led to an increase in consumption, investment, government spending, and net exports, resulted in a dramatic increase in aggregate demand, and subsequently an annual growth rate that ranks among the highest in the world. Today, Myanmar’s future is as bright as its rich historical past centuries ago.
As important as aggregate demand is in determining an economy’s output, aggregate demand tells only one part of the story. The other part, aggregate supply, describes the impetus for businesses to create and produce goods and services, which we turn to next.
CHECKPOINT
AGGREGATE DEMAND
The aggregate demand curve shows the relationship between real GDP and the price level.
The aggregate demand curve has a negative slope because of the impact of the price level on financial wealth, exports, and interest rates.
The determinants of aggregate demand are consumer spending, investment spending, government expenditures, and net exports. Changes in any of these determinants will shift the aggregate demand curve.
QUESTION: Housing and stock market prices have risen substantially in recent years. Explain how this affects aggregate demand in an economy.
Answers to the Checkpoint questions can be found at the end of this chapter.
An increase in home prices and stock values would increase the wealth of those who owned these assets. An increase in wealth provides greater financial security, even if income does not change. All else equal, consumption would rise, which would increase aggregate demand.