FIGURE APX-1 CIVILIAN EMPLOYMENT, 16 YEARS AND OLDER
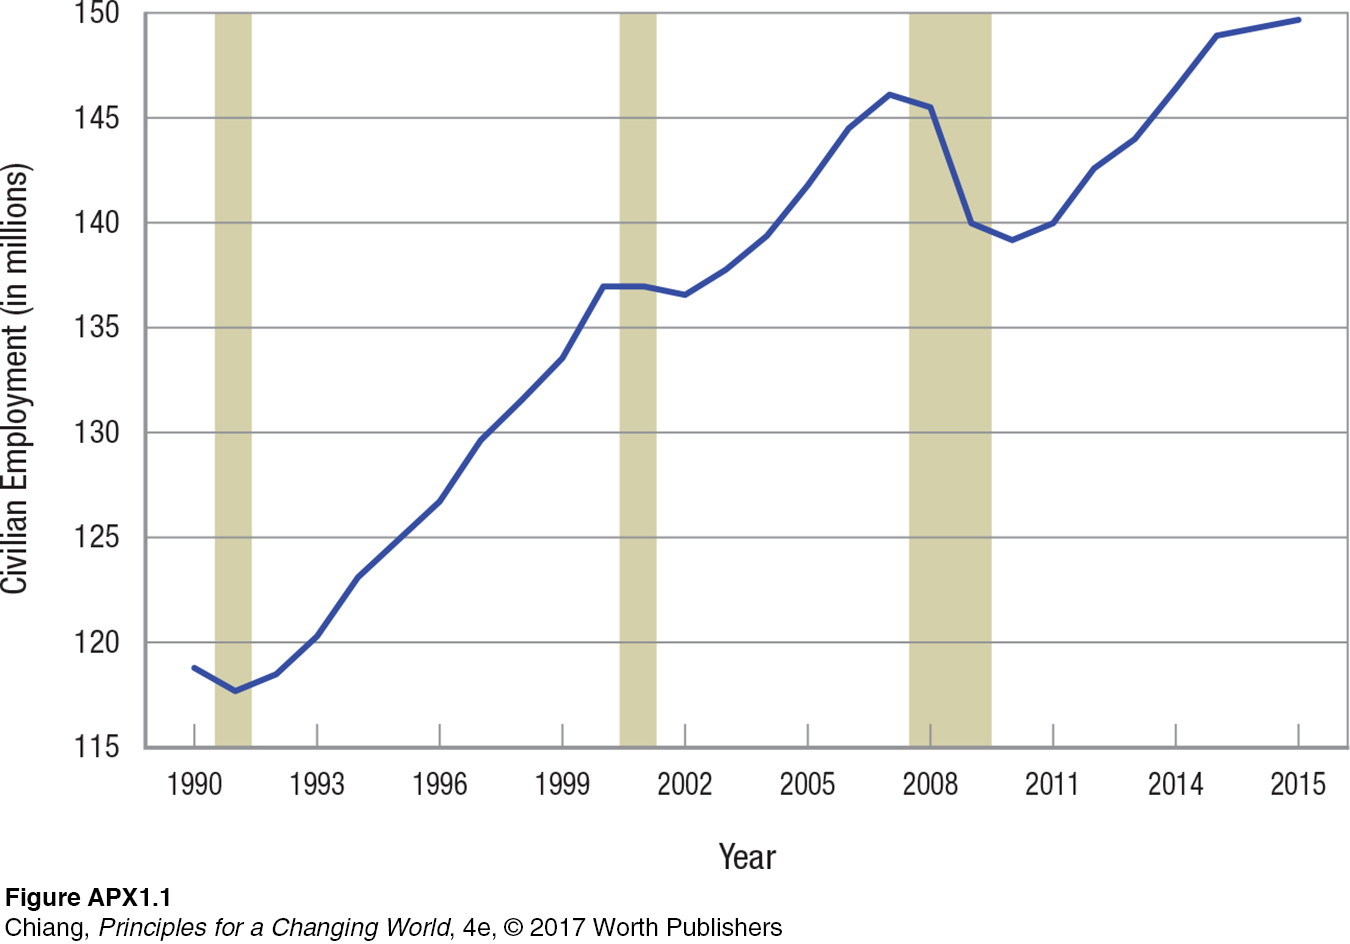 This time series graph shows the number of civilians 16 years and older employed in the United States since 1990. Employment has grown steadily over this period, except in times of recession, indicated by the vertical strips. Note that employment fell during the recession, and then bounced back after each recession ended.