FIGURE AP
X-
4
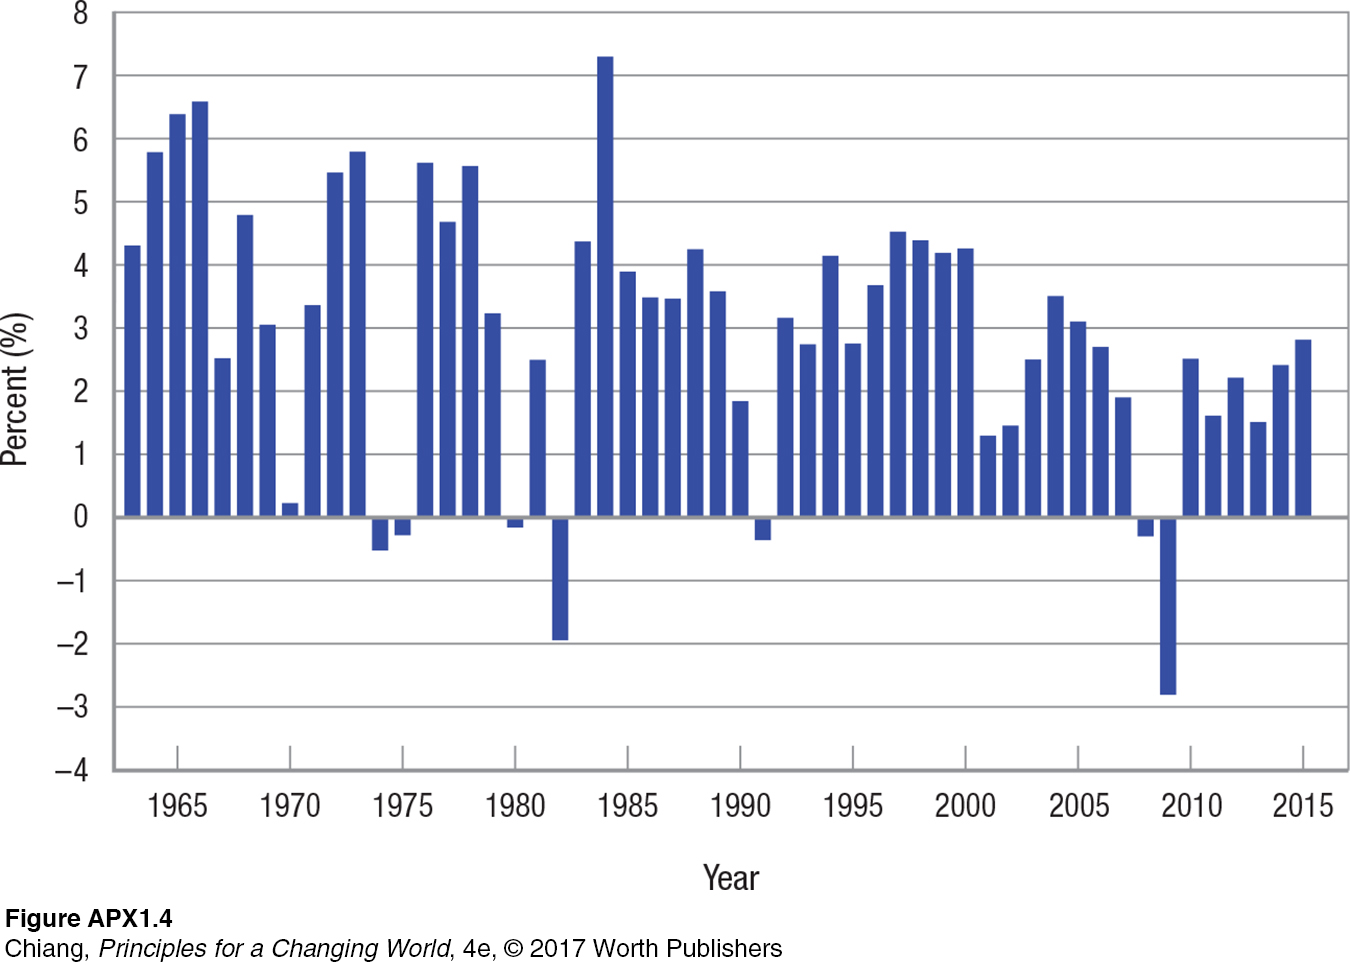
PERCENT CHANGE IN REAL (INFLATION ADJUSTED) GDP
This bar chart shows the annual percent change in real (adjusted for inflation) gross domestic product (GDP) over the last 50 years. Over this period, GDP declined only 7 times.