FIGURE 5 THE KINKED DEMAND CURVE MODEL OF OLIGOPOLY
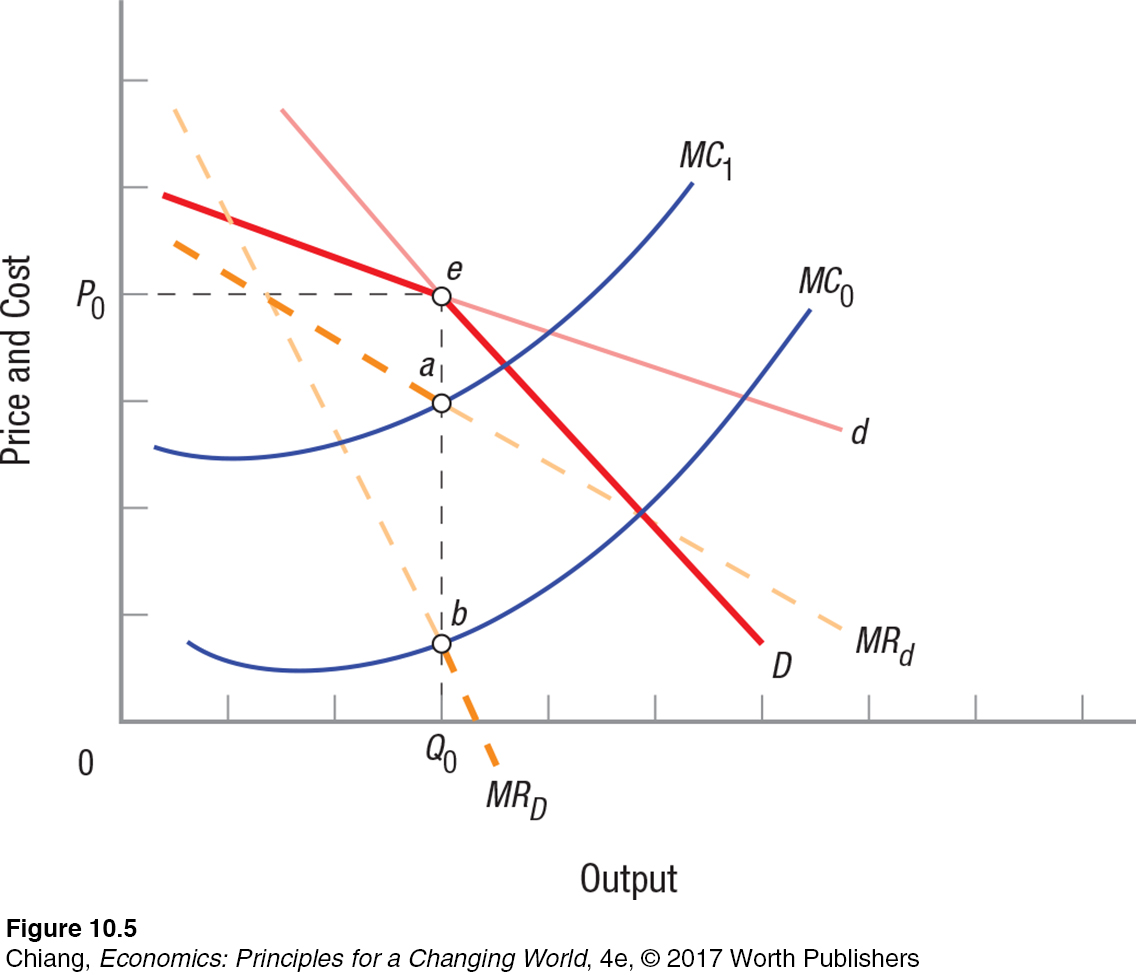 The kinked demand curve model of oligopoly shows why oligopoly prices appear stable. The model assumes that if the firm raises its price, competitors will not follow the price increase. But if the firm lowers its price, other firms will follow. These reactions create a “kink” in the firm’s demand curve at point e, and a discontinuity in the MR curve equal to the distance between points a and b. This discontinuity permits any marginal cost curve located between points a and b to produce the same output level, Q0.
[Leave] [Close]