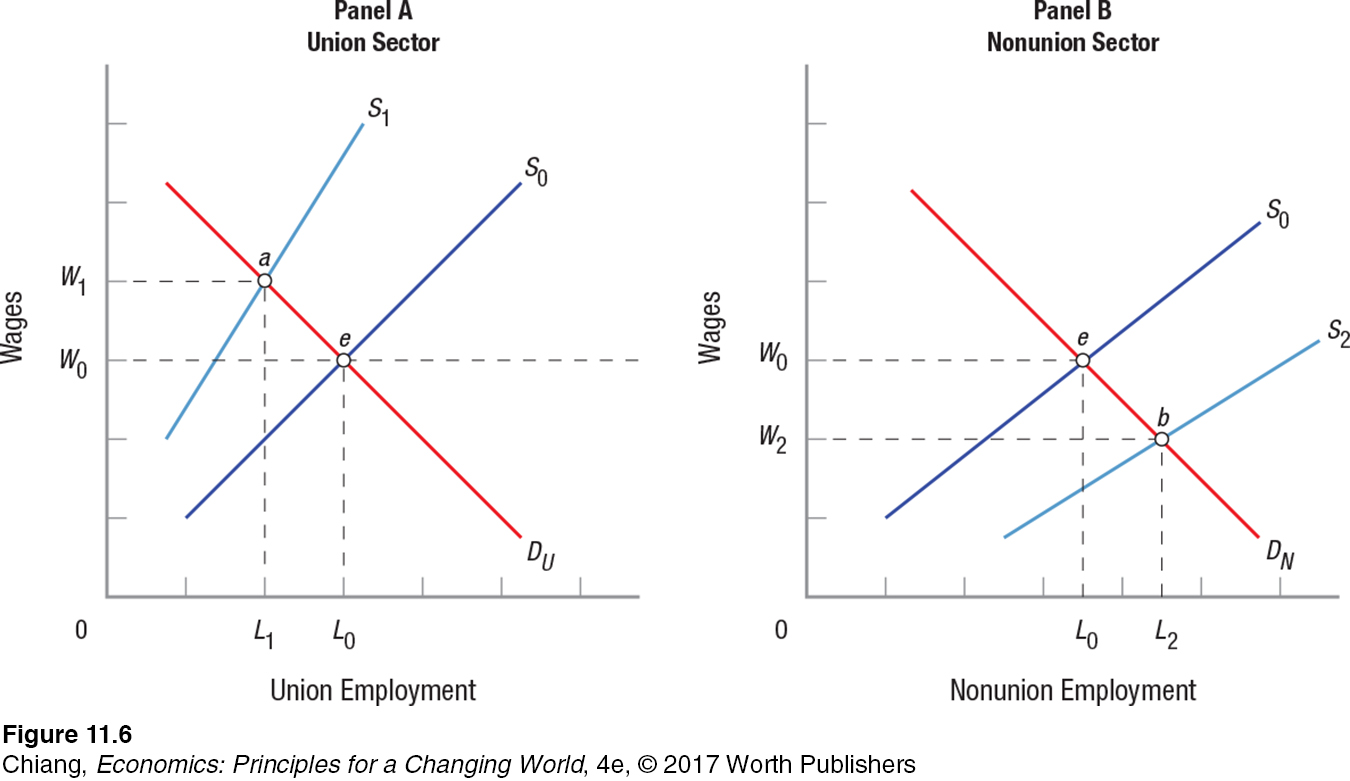
FIGURE 6 UNION VERSUS NONUNION WAGE DIFFERENTIALS
 This figure illustrates the analysis of union−nonunion wage differentials. Unions increase wages in their sectors by restricting entry into union jobs. Assuming the markets for unionized and nonunionized jobs begin at equilibrium, at point e in both panels, union and nonunion wages are initially W0. If the union successfully restricts supply to S1 in panel A, union wages will rise to W1, but employment will fall to L1 (point a). Those workers released will have no choice but to move to the nonunion sector represented in panel B, thus increasing its supply to S2. Equilibrium in the nonunion sector thus moves to point b, where more workers (L2) are employed at a lower wage (W2). The result is a wage differential equal to W1 − W2.
[Leave] [Close]