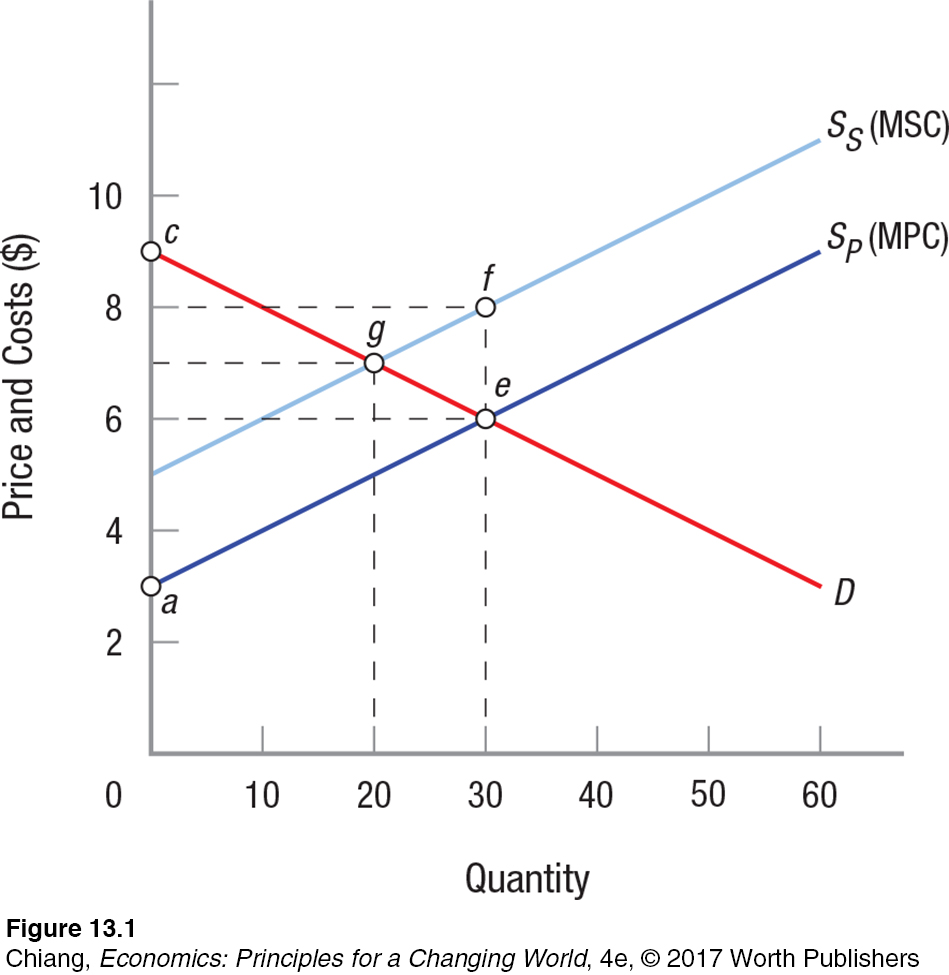
FIGURE 1 THE NEGATIVE EXTERNALITY CASE
 Supply curve SP represents the manufacturer’s supply when only its private costs are considered, ignoring the external costs imposed on others through pollution. Market equilibrium is 30 units sold at $6 each (point e). If each unit of production results in $2 in pollution costs, then supply curve SS represents the marginal social costs (MSC) to manufacture the product. Socially optimal output is 20 units sold at $7 each (point g).
[Leave] [Close]