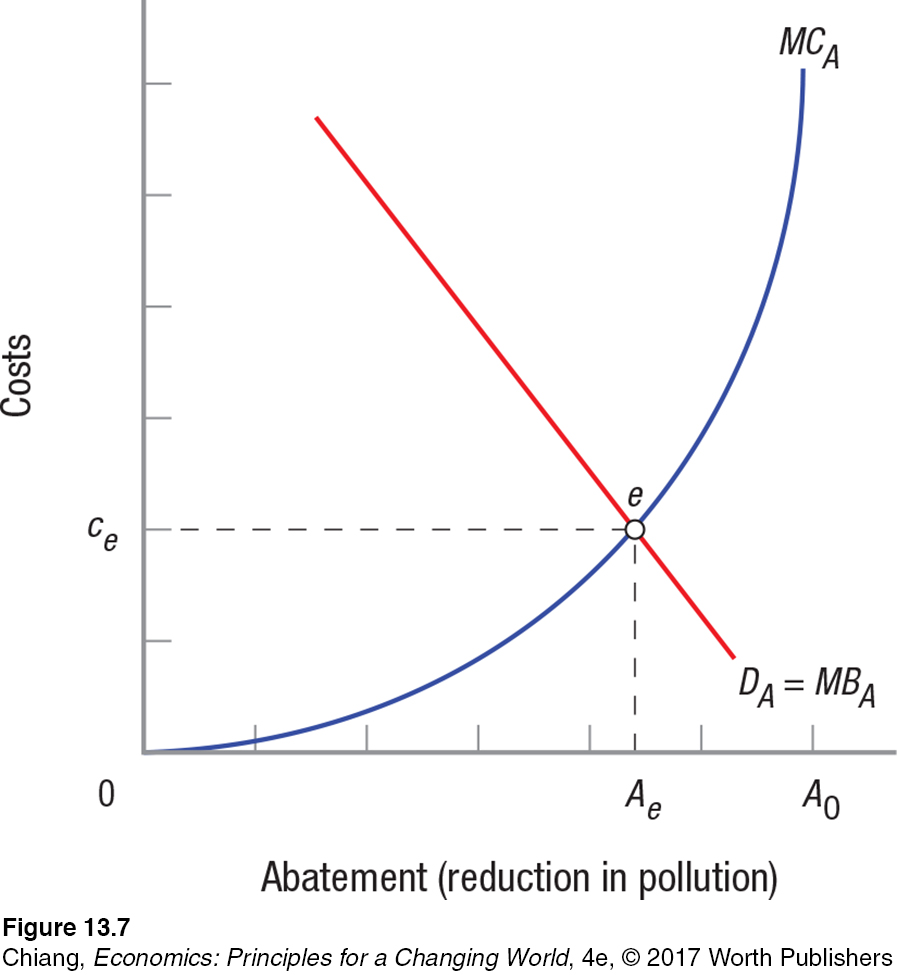
FIGURE 7 MARGINAL COST OF ABATEMENT AND ABATEMENT DEMAND
 Demand curve DA represents society’s demand for abatement. The marginal benefit from abatement (MBA) declines as the environment becomes cleaner, because the gains from an ever cleaner environment become smaller and smaller (diminishing returns). The marginal costs of abatement are the costs of reducing pollution. These costs rise with abatement efforts and become high as zero pollution A0 is approached (again, because of the law of diminishing returns, or increasing costs). Optimal abatement is Ae, costing ce. This means optimal pollution, A0 − Ae, is greater than zero.
[Leave] [Close]