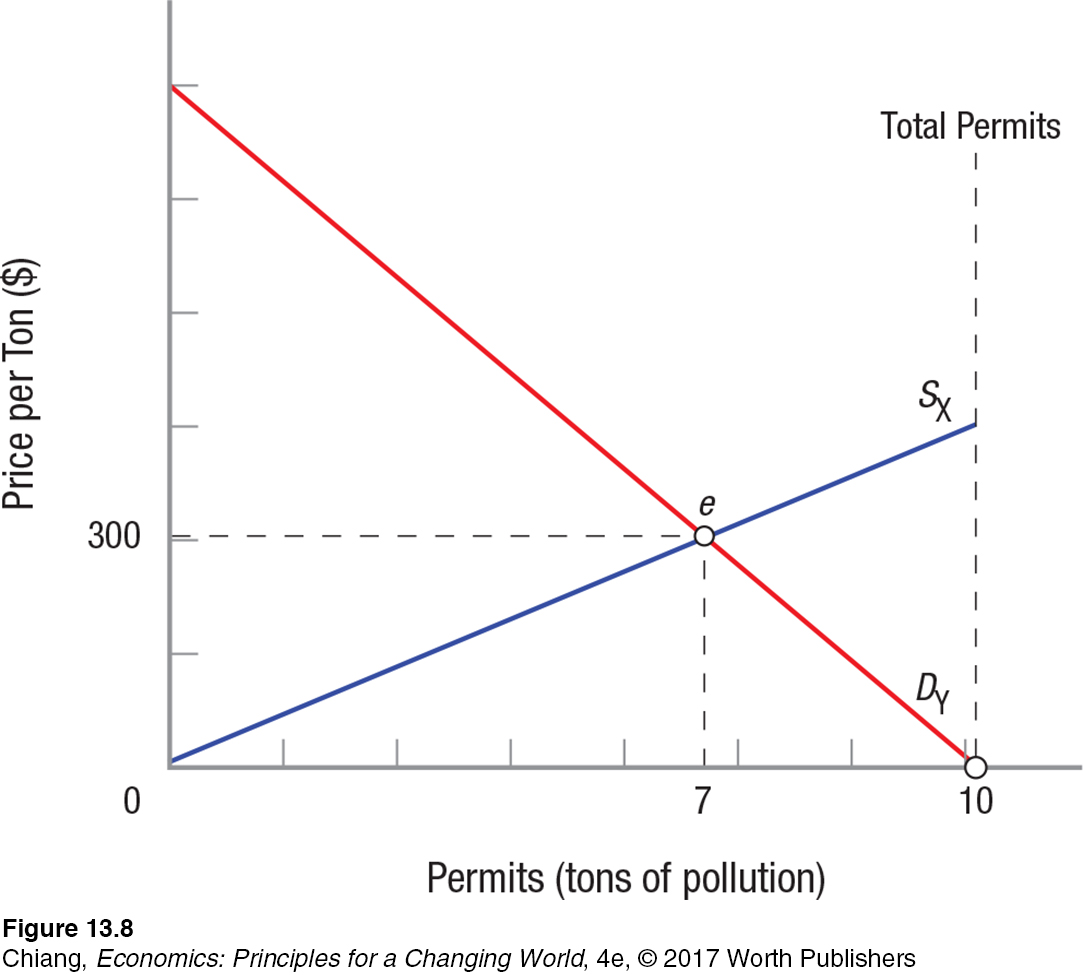
FIGURE 8 TRADABLE PERMITS
 This figure illustrates how a market for tradable pollution permits works. Assume there are only two firms (X and Y) in the market and the government wishes to limit total pollution to 10 tons. Without restrictions, both firms do zero abatement and pollution is 20 tons. Setting a goal of 10 tons therefore amounts to cutting pollution in half. Assume that the government gives the permits to firm X. Demand curve DY represents firm Y’s demand for these permits. Given a competitive market for permits, equilibrium will be at point e with a permit price equal to $300. Firm Y buys 7 permits and pollutes that amount, and firm X emits 3 tons of pollution.
[Leave] [Close]