FIGURE 6 POVERTY RATES BY RACE AND ETHNIC ORIGIN, 1970– 2014
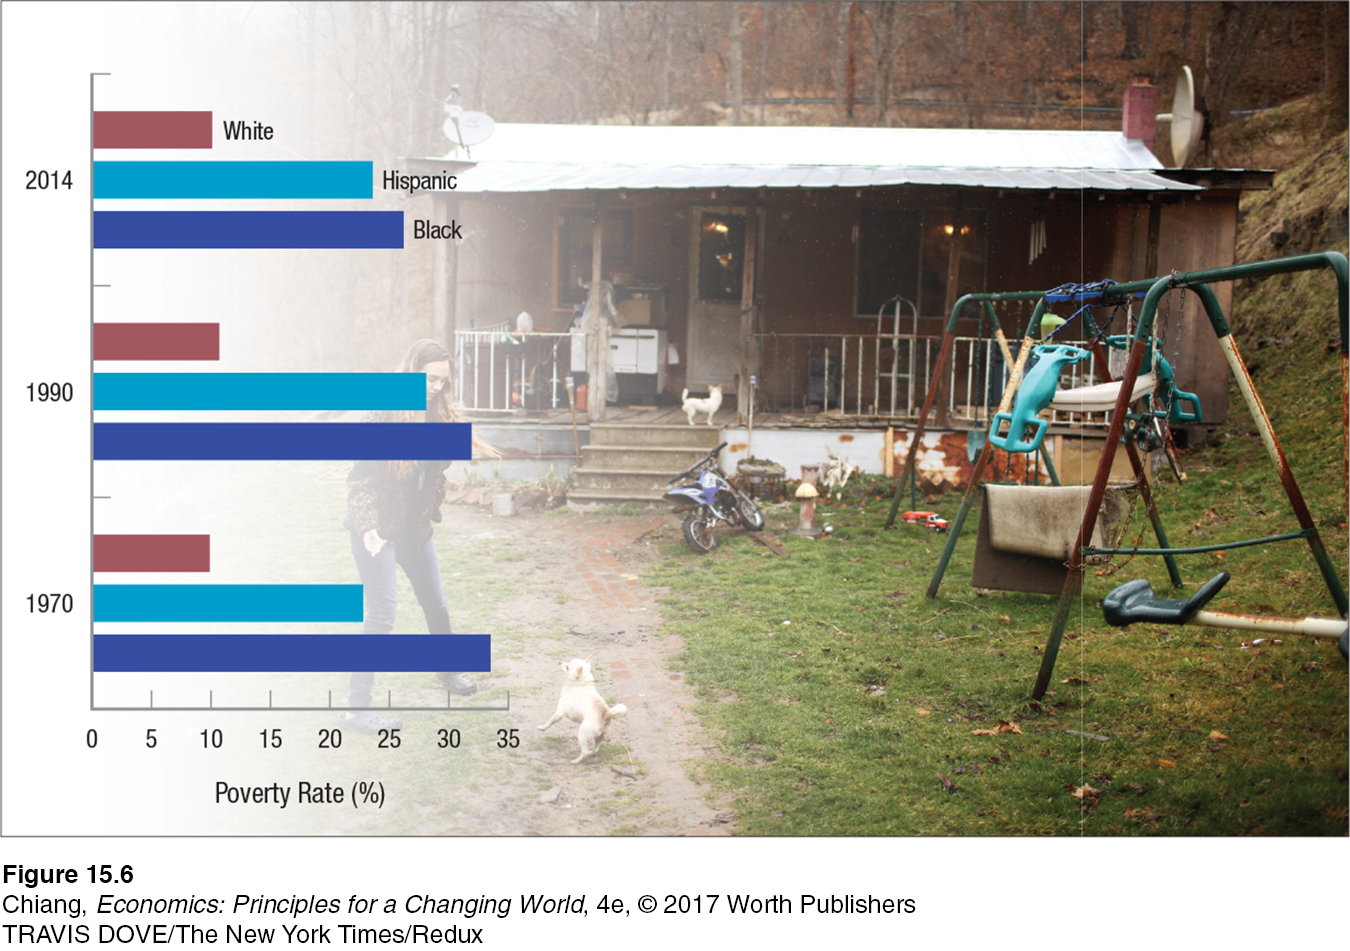 Poverty rates for whites, blacks, and Hispanics are shown for the years 1970, 1990, and 2014. The poverty rates for blacks and Hispanics have fallen since the 1990s to around 25% today, but remain well above the poverty rate for whites.
Data from U.S. Census Bureau, Current Population Reports, P60- 252, Income and Poverty in the United States: 2014 (Washington, DC: U.S. Government Printing Office), 2015.
[Leave] [Close]