FIGURE 4 CHANGES IN DEMAND VERSUS CHANGES IN QUANTITY DEMANDED
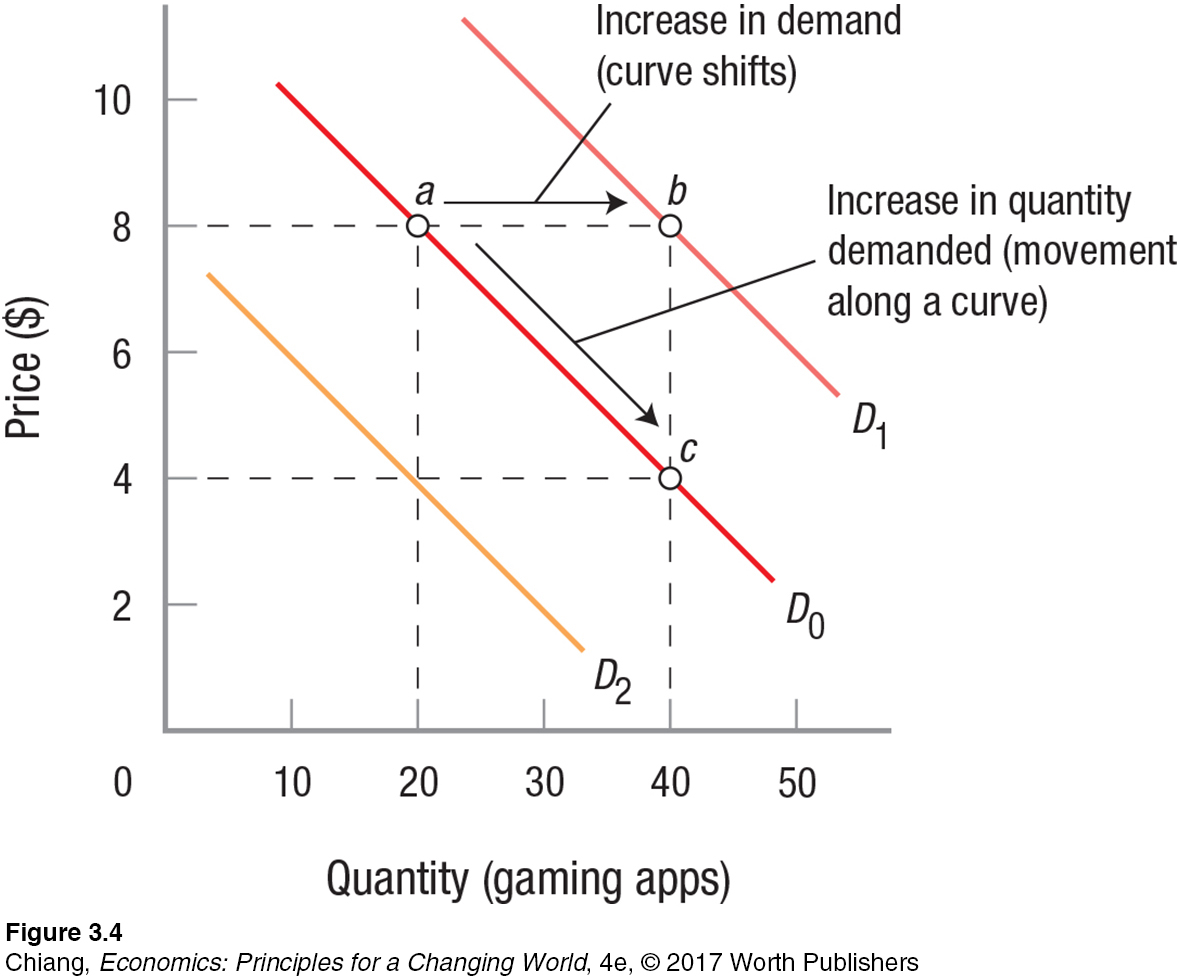 A shift in the demand curve from D0 to D1 represents an increase in demand, and consumers will buy more of the product at each price. A shift from D0 to D2 reflects a decrease in demand. A movement along D0 from point a to point c indicates an increase in quantity demanded; this type of movement can only be caused by a change in the price of the product.
[Leave] [Close]