FIGURE 7 CHANGES IN SUPPLY VERSUS CHANGES IN QUANTITY SUPPLIED
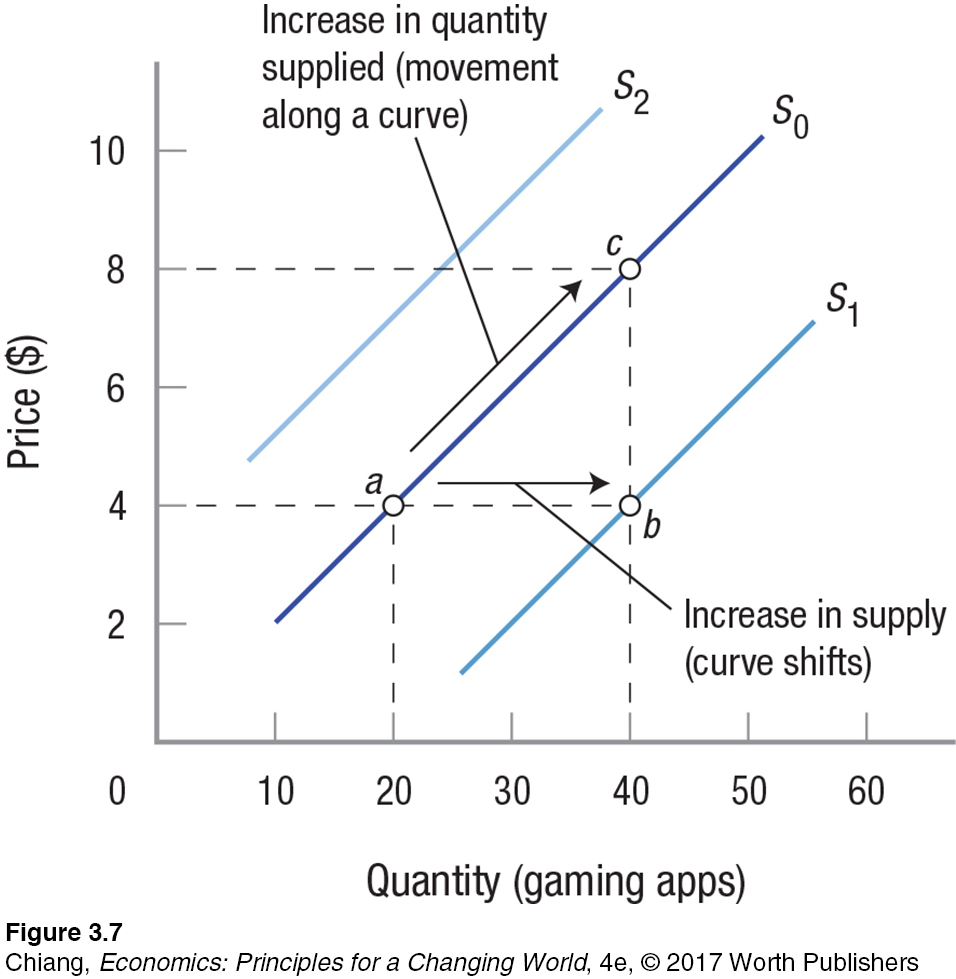 A shift in the supply curve from S0 to S1 represents an increase in supply, because businesses are willing to offer more of the product to consumers at all prices. A shift from S0 to S2 reflects a decrease in supply. A movement along S0 from point a to point c represents an increase in quantity supplied; this type of movement can only be caused by a change in the price of the product.
[Leave] [Close]