FIGURE 2 CONSUMER AND PRODUCER SURPLUS
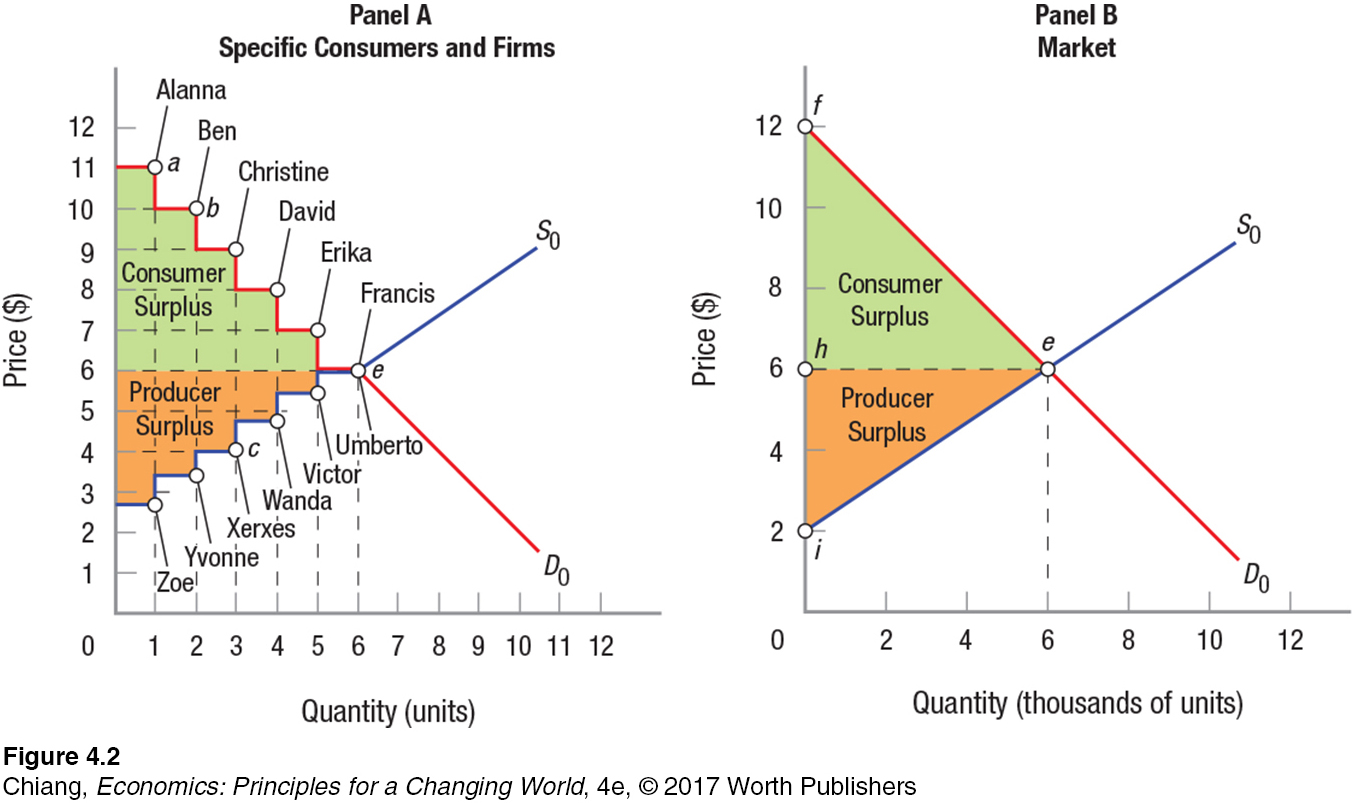 Panel B shows a market consisting of many more of the specific consumers and firms shown in panel A. This market determines equilibrium price to be $6 (point e), and total sales for the market are 6,000 units. Consumer surplus is equal to the area under the demand curve but above the equilibrium price of $6. Producer surplus is the area under the equilibrium price but above the supply curve.
[Leave] [Close]