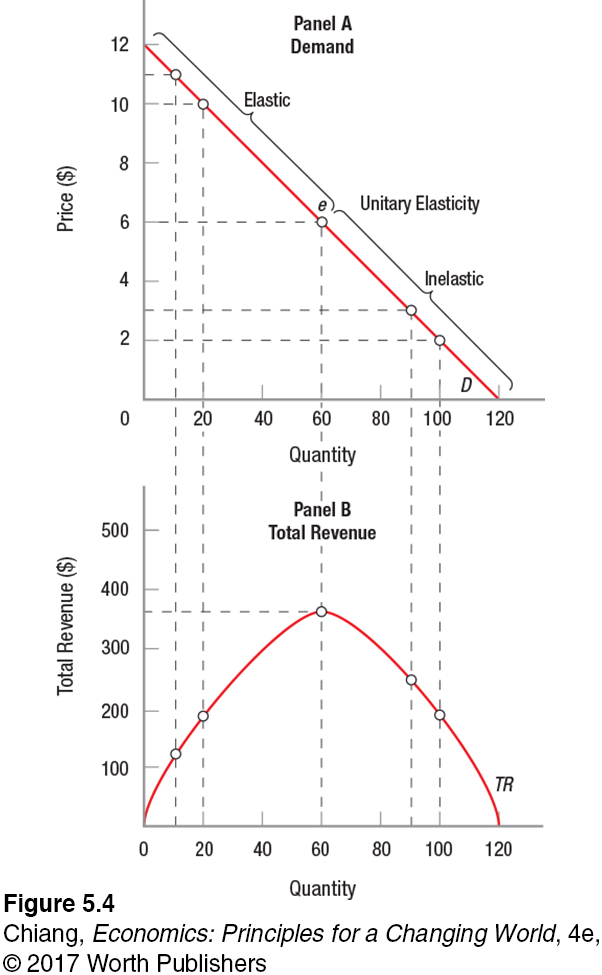
FIGURE 4PRICE ELASTICITY AND TOTAL REVENUE ALONG A STRAIGHT-LINE (LINEAR) DEMAND CURVE
Price elasticity varies along a straight-line demand curve. In panel A, the elastic part of the curve lies above point e. Thus, when price falls from $11 to $10, revenue rises, as shown in panel B. As we move down the demand curve, elasticity equals 1 (at point e), where elasticity is unitary. Revenue is maximized at this point. As price continues to fall below $6, demand moves into an inelastic range. When price falls from $3 to $2, revenue declines, as shown in panel B.
 Price elasticity varies along a straigh