FIGURE APX- 4 DERIVING THE DEMAND FOR WALL CLIMBING USING INDIFFERENCE CURVE ANALYSIS
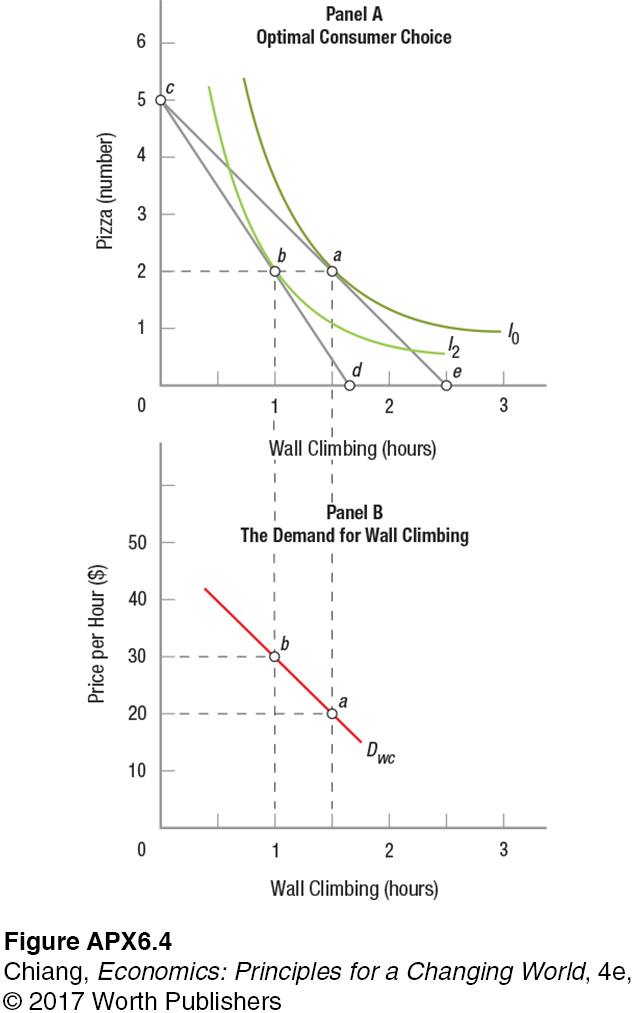 In panel A, when wall climbing costs $20 per hour, your optimal choice is found at point a. When the price of wall climbing rises to $30 per hour, this produces a new budget line, cd, shifting the optimal choice to point b. Transferring points a and b down to panel B and connecting the points generate the demand curve for wall climbing.
[Leave] [Close]