FIGURE 4 TOTAL AND MARGINAL UTILITY FOR PIZZA
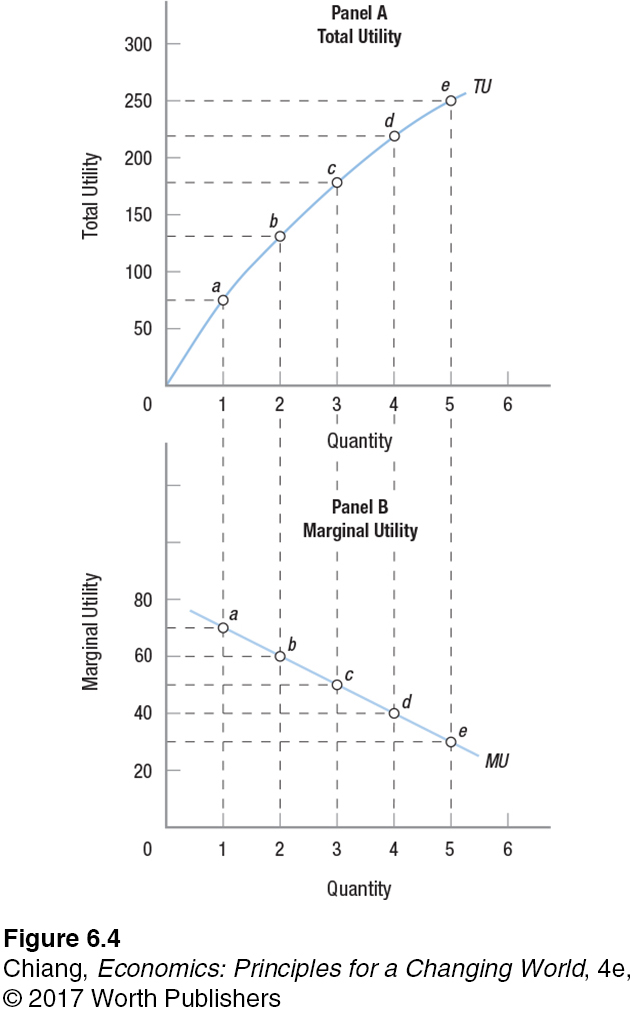 Total utility, graphed in panel A, rises continually as we move from 1 pizza per week to 5. Nevertheless, the rate of this increase declines as more pizzas are consumed. Accordingly, panel B shows that marginal utility declines with more pizzas eaten.
[Leave] [Close]