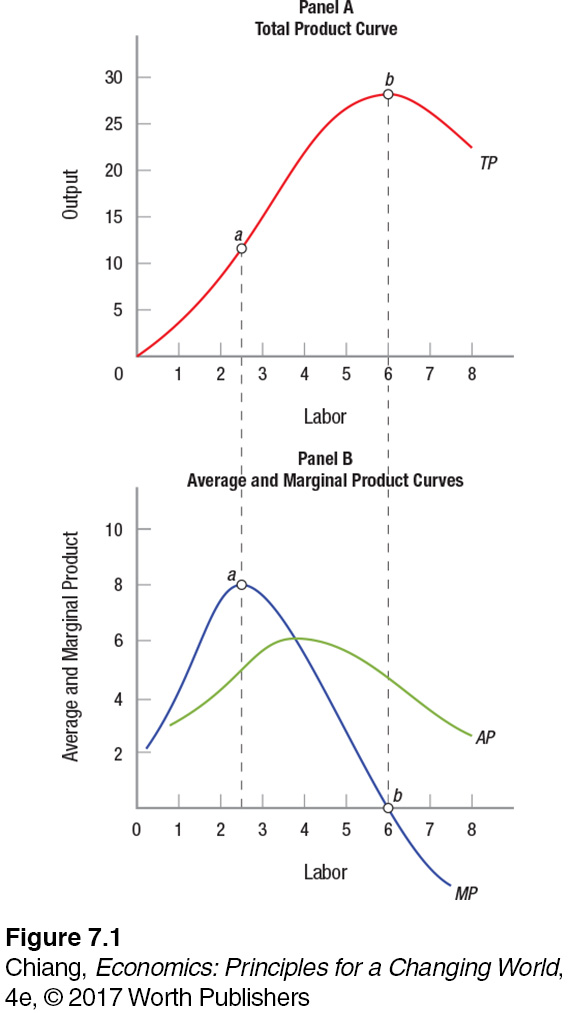
FIGURE 1 TOTAL PRODUCT CURVE, MARGINAL PRODUCT, AND AVERAGE PRODUCT
 These two panels show the relationship between additional labor and productivity. Panel A shows how increasing labor increases productivity, up to a point. Panel B shows marginal and average product. Marginal product reaches its maximum as the third worker is hired, after which marginal product starts decreasing. Total product keeps increasing, however, until you reach 6 employees. At that point, marginal product becomes negative, meaning that each additional employee actually reduces production.
[Leave] [Close]