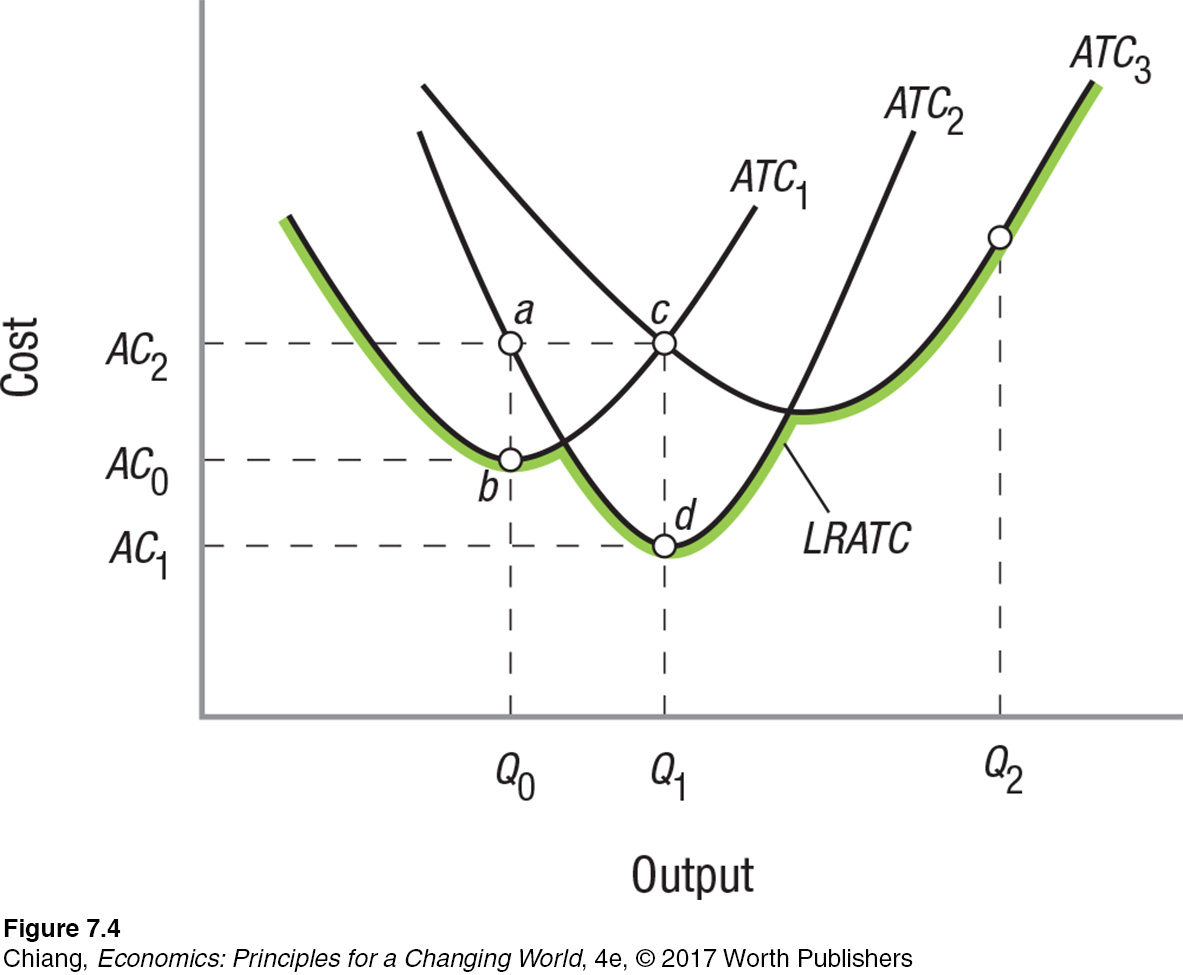
FIGURE 4 VARIOUS SHORT- RUN AVERAGE COST CURVES AND THE LONG- RUN AVERAGE TOTAL COST CURVE
 This figure shows the average total cost curve for three plants of different sizes. The larger plants have relatively high average total costs at lower levels of output, but much lower average total costs at higher output levels. Firms are free to adjust plant size in the long run; therefore, they can switch from one plant type to the next to minimize their costs at each production level. The green envelope curve represents the firm’s lowest cost to produce any given output in the long run and represents the LRATC curve.
[Leave] [Close]