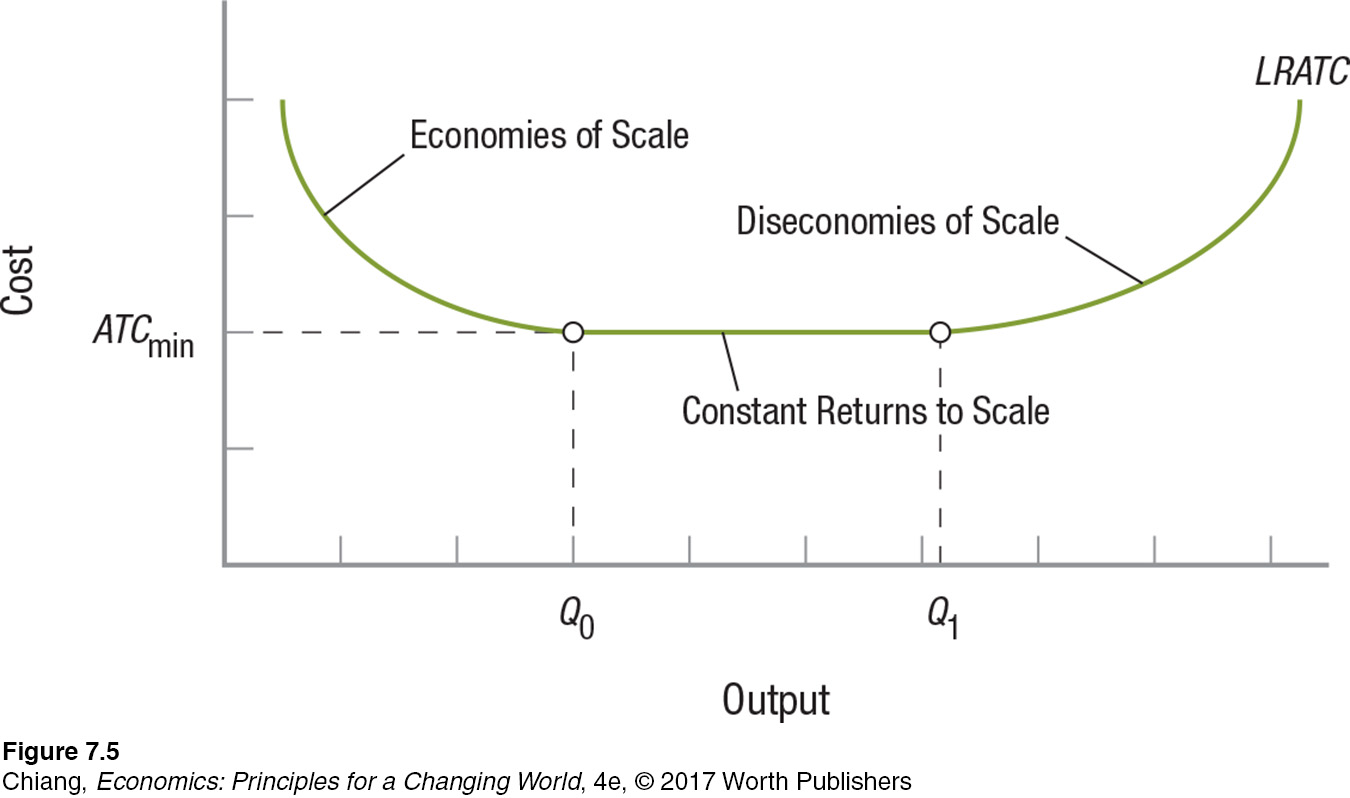
FIGURE 5 ECONOMIES, DISECONOMIES, AND CONSTANT RETURNS TO SCALE
 The curve in this figure shows how increasing production affects long-run average total cost (LRATC). Up to Q0, economies of scale reduce LRATC as production increases. Over the range Q0 to Q1, the firm enjoys constant returns to scale, meaning that it can expand without affecting LRATC. Past Q1, however, diseconomies of scale kick in, such that any further expansion causes an increase in LRATC.
 The curve in this figure shows how increasing production affects lon
 The curve in this figure shows how increasing production affects lon