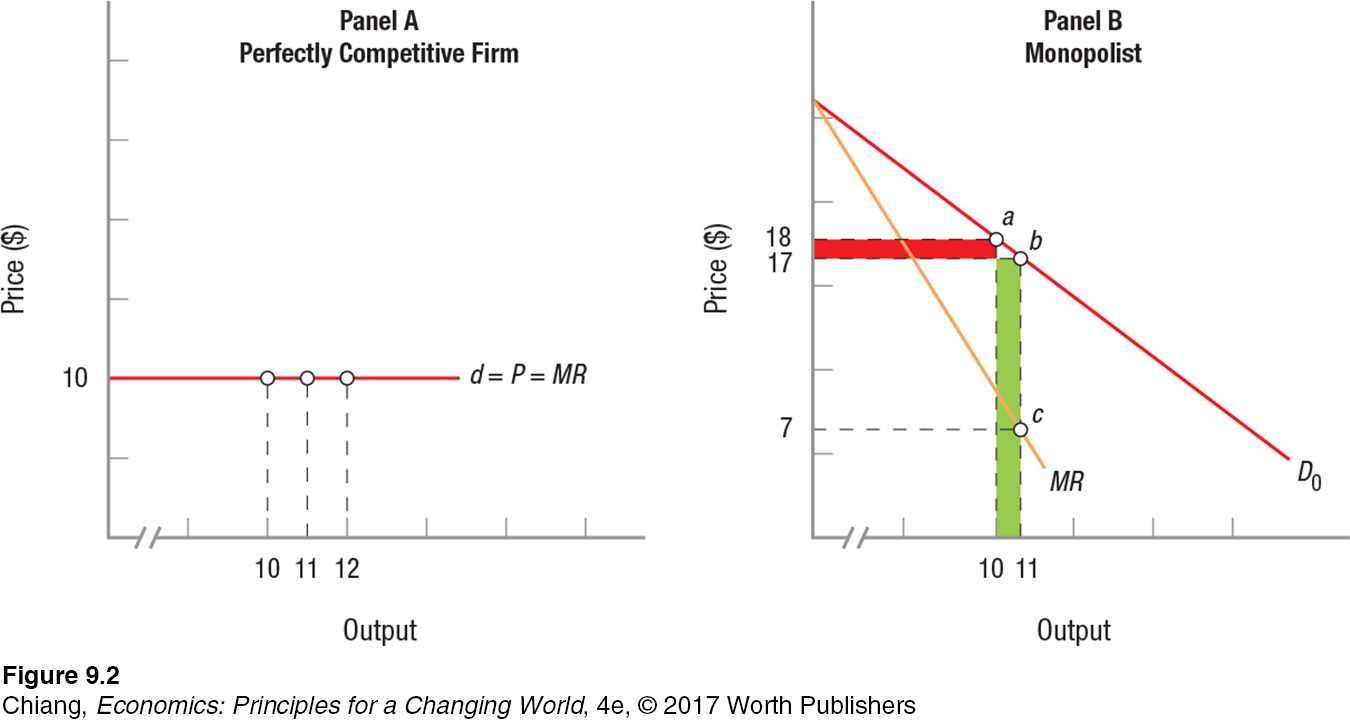
FIGURE 2 MARGINAL REVENUE FOR MONOPOLIES AND PERFECTLY COMPETITIVE FIRMS
 Panel A shows the demand curve for a perfectly competitive firm. At a price of $10, the competitive firm can sell all it wants. For each unit sold, revenue rises by $10; hence, marginal revenue is $10. Panel B shows the demand curve for a monopolist. Because the monopolist constitutes the entire industry, it faces a downward-sloping demand curve (D0). If the monopolist decides to sell 10 units at $18 each (point a), total revenue is $180. Alternatively, if the monopolist wants to sell 11 units, the price must be dropped to $17 (point b). This raises total revenue to $187 (11 × $17), but marginal revenue falls to $7 ($187 − $180, point c). Gaining the added $17 in revenue from the sale of the 11th unit requires the monopolist to give up $10 in additional revenue that would have come from selling the previous 10 units for an extra $1, or $18 each.
 Panel A shows the demand curve for a perfectly competitive firm. At a price of $10, the competitive firm can sell all it wants. For each unit sold, revenue rises by $10; hence, marginal revenue is $10. Panel B shows the demand curve for a monopolist. Because the monopolist constitutes the entire industry, it faces a downwar