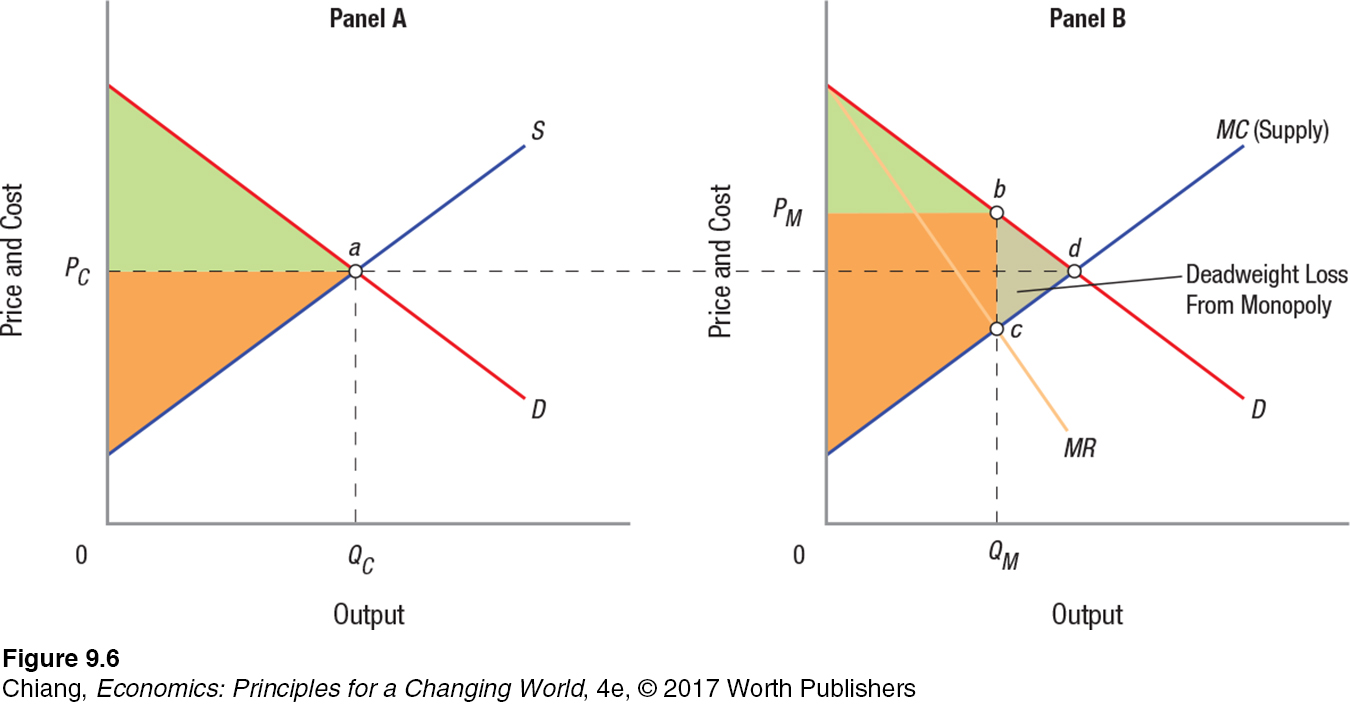
FIGURE 6 MONOPOLY INEFFICIENCY
 This figure shows what would happen if a competitive industry were monopolized and the new monopolist’s marginal cost curve was the same as the competitive industry’s supply curve. When the industry was competitive, it produced where S = D, and thus where price and output are PC and QC (point a in panel A). Monopoly price and output, however, are PM and QM (point b in panel B); output is lower and price is higher than the corresponding values for competitive firms. As a result, part of consumer surplus (shown in green) is transferred into producer surplus (shown in orange) in a monopoly, and in the process, inefficiency is created in the form of deadweight loss (shaded area bcd).
[Leave] [Close]