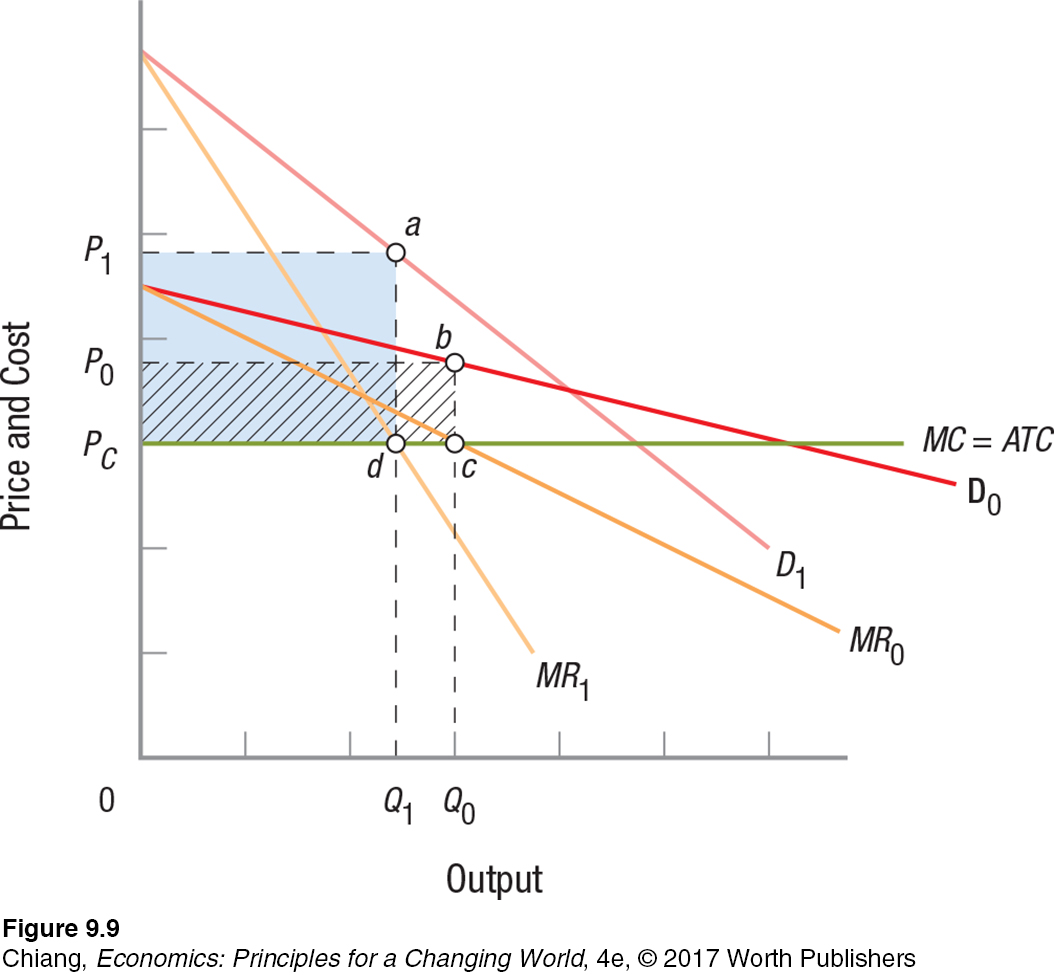
This figure illustrates third-degree price discrimination, in which firms segment markets based on consumers’ willingness-to-pay in order to maximize producer surplus. The two demand curves, D0 and D1, represent two segments of a market with different demand elasticities. The less elastic market, D1, is offered price P1, which is higher than price P0, offered to the more elastic market, D0, thus maximizing the profits in both markets.
 This figure illustrates thir