Printed Page 23(cont.)
Graphs and Models
Let’s now take a brief look at how economists use graphs and models, also looking at how they are constructed. Economists use what are called “stylized graphs” to represent relationships between variables. These graphs are a form of modeling to help us simplify our analysis and focus on those relationships that matter. Figure APX-6 is one such model.
Figure 1.6: FIGURE APX-6 STUDYING AND YOUR GPA
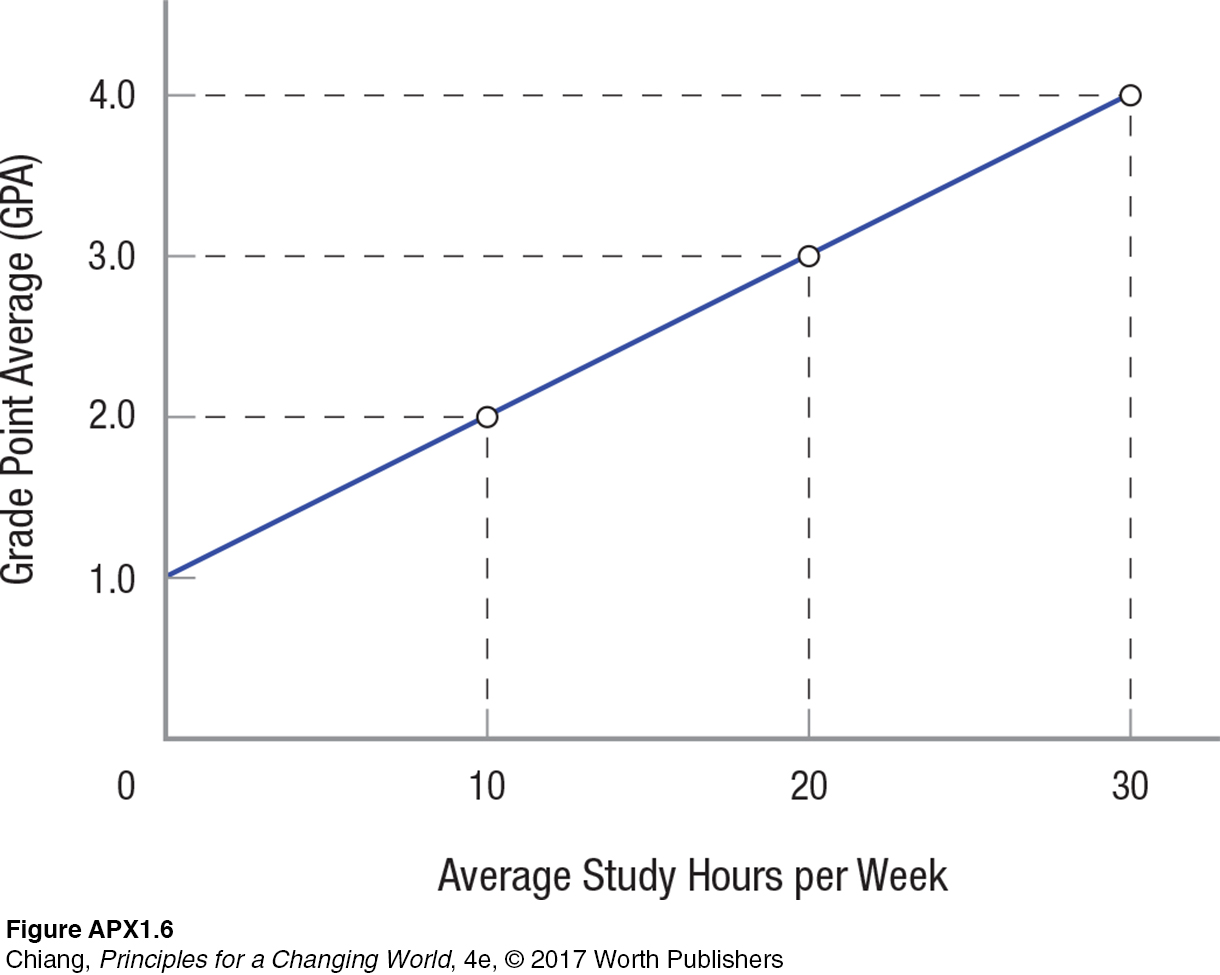
Figure 1.6: This figure shows a hypothetical linear relationship between average study hours and GPA. Without studying, a D average results, and with 10 hours of studying, a C average is obtained, and so on.
[Leave] [Close]