REGULATION AND ANTITRUST
We have seen that monopolies have the ability to raise prices and restrict quantities, putting them at the other end of the spectrum from the competitive market price-
Regulating the Natural Monopolist
natural monopoly An industry exhibiting large economies of scale such that the minimum efficient scale of operations is roughly equal to market demand.
As we saw when we discussed barriers to entry, there are some instances when natural monopolies occur. A natural monopoly exists when economies of scale are so large that the minimum efficient scale of operation is roughly equal to market demand. In this case, efficient production can only be accomplished if the industry lies in the hands of one firm—
How can policymakers prevent natural monopolists from abusing their positions of market dominance? There are various approaches to dealing with natural monopolies: (1) They can be publicly owned, (2) they can be privately owned but subjected to price and quantity constraints, or (3) their right to operate could be auctioned to the firm agreeing to the most competitive price and quantity conditions.
A market representing a natural monopoly is shown in Figure 10. Notice that the average cost and marginal cost curves decline continually because of large economies of scale.
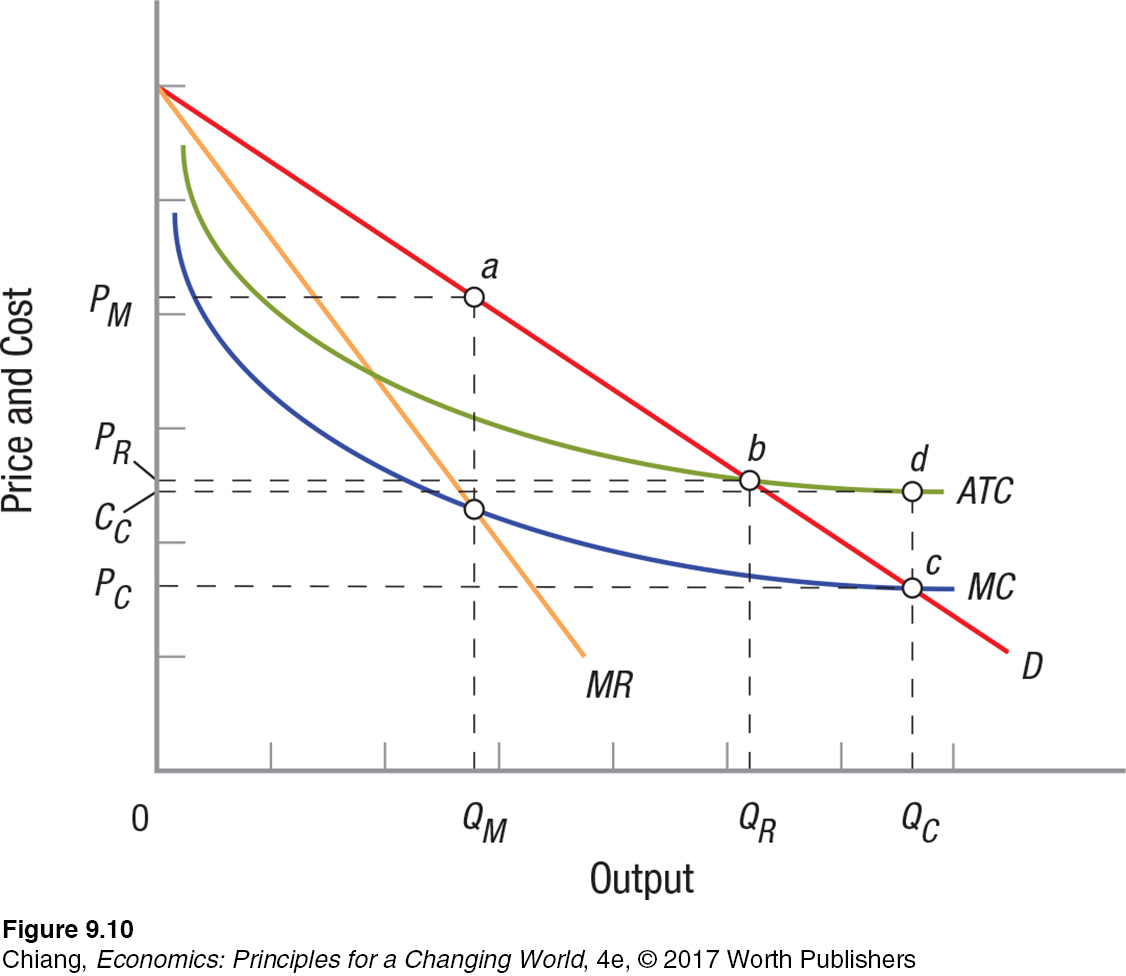
If the monopolist were a purely private firm, it would produce only output QM and sell this for price PM (point a). Accordingly, the monopolist would earn economic or monopoly profits, and consumers would be harmed, receiving a lower output at a higher price. This is the major argument for regulation.
marginal cost pricing rule Regulators would prefer to have natural monopolists price where P = MC, but this would result in losses (long term) because ATC > MC.
Marginal Cost Pricing Rule Ideally, regulators would like to invoke the P = MC rule of competitive markets and force the firm to sell QC units for a price of PC. This is the marginal cost pricing rule and would be the optimal resource allocation solution. Yet, because price PC is below the average total cost of production for output QC, this would force the firm to sustain losses of cd per unit, ultimately driving it out of business. The public sector could subsidize the firm by an amount equal to area PCCCdc; this subsidy allows the firm to supply the socially optimal output at the socially optimal price, while earning a normal return. This approach has not been used often in the United States. Amtrak, with its history of heavy subsidies for maintaining rail service, may be the one major exception.
average cost pricing rule Requires a regulated monopolist to produce and sell output where price equals average total cost. This permits the regulated monopolist to earn a normal return on investment over the long term and therefore remain in business.
Average Cost Pricing Rule The more common approach to regulation in the United States has been to insist on an average cost pricing rule. Such a rule requires that the monopolist produce and sell output where price equals average total cost. This is illustrated by point b in Figure 10, where the demand curve intersects the ATC curve and the firm produces output QR and sells it for price PR. The result is that the firm earns a normal return. Consumers do lose something, in that they must pay a higher price for less output than they would under ideal competitive conditions. Still, the normal profits keep the firm in business, and the losses to consumers are significantly less than if the firm were left unregulated.
Regulation in Practice The United States has a long history of public utility regulation. For most of this history, regulation has been accepted as the lesser of two evils. Monopolists have long been viewed with distrust, but regulators have just as often been portrayed as incompetent and ineffectual, if not lapdogs of the industries they regulate.1 Although this characterization is probably unfair, a number of economists, including Nobel Prize–
1 See George Stigler, “The Theory of Economic Regulation,” Bell Journal of Economics, 1971, pp. 3–
GEORGE STIGLER (1911–1991)
NOBEL PRIZE
Few modern economists have broken ground in so many different areas as George Stigler, described by some admirers as the “ultimate empirical economist.” His 1982 Nobel Prize cited seminal work in industrial structure, the functioning of markets, and the causes and effects of public regulation.
Born in 1911 in the Seattle suburb of Renton, Washington, Stigler attended graduate school at the University of Chicago with fellow students and eventual Nobel Prize winners Milton Friedman and Paul Samuelson. Stigler later became a professor at the University of Chicago, where he remained until his death in 1991.
Exploring the relationship between size and efficiency led him to the “Darwinian” conclusion that by observing competition in an industry, he could determine the most efficient sizes for firms, a method he called “the survivor technique.” In the 1960s, Stigler studied the impacts of government regulation on the economy with skepticism, arguing that government interventions were often designed to optimize market conditions for producers instead of protecting the public interest. This work opened up a new field known as “regulation economics” and kindled greater interest in the relationship between law and economics.
Regulating a large enterprise always presents immense difficulties and tradeoffs. For one thing, finding a point like b in Figure 10 is difficult in practice, given that estimating demand and cost curves is an inexact science, at best, and markets are always changing. In practice, regulators must often turn to rate of return or price cap regulation.
rate of return regulation Permits product pricing that allows the firm to earn a normal return on capital invested in the firm.
Rate of return regulation allows a firm to price its product in such a way that it can earn a normal return on capital invested. This leads to added regulations about the acceptable items that can be included in costs and capital expenditures. Can the country club memberships of top executives be counted as capital investments? Predictably, firms always want to include more expenses as legitimate business expenses, and regulators want to include fewer. Regulatory commissions and regulated firms often have large staffs to deal with such issues, and protracted court battles are not uncommon.
price caps Maximum price at which a regulated firm can sell its product. They are often flexible enough to allow for changing cost conditions.
Alternatively, regulators can impose price caps on regulated firms, which place maximum limits on the prices firms can charge for products. These caps can be adjusted in response to changing cost conditions, including changes in labor costs, productivity, technology, and raw material prices.
Today, the pace of technological change is so rapid that regulation has lost some of its earlier luster and is not used as often. In fact, many utilities such as telephone services and cable television are so competitive that regulation is not as necessary compared to when they were once monopolies. Therefore, rather than regulate natural monopolies, government has sought to prevent monopolies and monopolistic practices from arising at all—
Antitrust Policy
antitrust law Laws designed to maintain competition and prevent monopolies from developing.
Rather than regulatory tinkering, governments have tried a broader approach to deal with monopolies and their market power. The goal of antitrust law is to preserve competition and prevent monopolies with their maximum market power from arising in the first place.
The origin of antitrust policy came in the late 1800s, when many large trusts were established, which brought many firms under one organizational structure allowing them to act as monopolists. Massive wealth accumulations by such “robber barons” as John D. Rockefeller (Standard Oil) and Jay Gould (railroads and stock manipulation) sparked resentment and fear against trusts and the growing inequity of income and wealth. Trusts had become so powerful—
The Major Antitrust Laws
Several major statutes form the core of the country’s antitrust laws. The most important provisions of these laws (as amended) are described in Table 1.
| TABLE 1 | MAJOR ANTITRUST LAWS | ||
|
|||
The intensity of antitrust enforcement has varied over the past century, from an early focus on monopolies, then on mergers, and more recently on price fixing—
Defining the Relevant Market and Market Power
The first problem involves defining market power. What is the relevant product market? Some markets can be severely limited geographically, such as concrete, with its extremely high transport costs, and dry cleaning, limited by the unwillingness of consumers to travel far for this service. Other markets are national in scope, like airlines, breakfast cereals, and electronics. Still others extend beyond the borders of a country, with the forces of global competition increasingly reducing domestic market power.
The second problem is determining the proper measuring device of market power. As an industry moves from competition to monopoly, pricing power rises from zero to total. One of the challenges economists have faced is developing one measure that accurately reflects market power or concentration for all these market structures.
Industries that become more concentrated increase the losses to society. Therefore, any measure of concentration should accurately reflect the ability of firms to increase prices above that point which would prevail under competitive conditions.
concentration ratio The share of industry shipments or sales accounted for by the top four or eight firms.
Concentration Ratios A widely used measure of industry concentration is the concentration ratio. The n-firm concentration ratio is the share of industry sales accounted for by the industry’s n largest firms. Typically, four-
Although useful in giving a quick snapshot of an industry, concentration ratios express only one piece of the market power distribution picture: the market share enjoyed by the industry’s four or eight largest firms. Table 2 shows the market shares of the four largest firms in two different industries. Industry 1 contains a dominant firm with 65% of the market, followed by a bunch of smaller firms. Industry 2 consists of four fairly equal-
| TABLE 2 | FOUR- |
|||
| Industry 1 is dominated by a large firm with 65% of market share, whereas Industry 2 contains four fairly equal- |
||||
| Industry 1 | Industry 2 | |||
| Firm 1’s market share | 65% | 25% | ||
| Firm 2’s market share | 10% | 20% | ||
| Firm 3’s market share | 5% | 20% | ||
| Firm 4’s market share | 5% | 20% | ||
| All other firms’ market share combined | 15% | 15% | ||
| Four- |
85 | 85 | ||
Without more information about each industry, concentration ratios are not overly informative, except to point out extreme contrasts. If one industry’s four-
Economists and antitrust enforcers, however, need finer distinctions than concentration ratios permit. For this reason, the profession has developed the Herfindahl–
Herfindahl–
Herfindahl–
HHI = (S1)2+ (S2)2 + (S3)2 + … + (Sn)2
where S1, S2, … Sn are the percentage market shares of each firm in the industry. Thus, the HHI is the sum of the squares of each market share. In a five-
HHI = 202 + 202 + 202 + 202 + 202
= 400 + 400 + 400 + 400 + 400
= 2,000
The HHI ranges from roughly zero (a huge number of small firms) to 10,000 (a one-
HHI = 652 + 152 + 102 + 52 + 52
= 4,225 + 225 + 100 + 25 + 25
= 4,600
The HHI is consistent with our intuitive notion of market power. It seems clear that an industry with several competitors of roughly equal size will be more competitive than an industry in which one firm controls a substantial share of the market.
Applying the HHI The Hart-
The Department of Justice and the FTC in 2010 issued revised merger guidelines based on the HHI. These guidelines classify industries as follows:
HHI < 1,500: Industry is not concentrated.
1,500 < HHI < 2,500: Industry is moderately concentrated.
HHI > 2,500: Industry is highly concentrated.
Mergers where the resulting HHI is below 1,500 will often be approved. Mergers with postmerger HHIs between 1,500 and 2,500 will be closely evaluated; they are often challenged if the proposed merger raises the HHI by 200 points or more. When the HHI for the industry exceeds 2,500, a postmerger rise in the HHI of 100 points is enough to spark a challenge.
These guidelines have worked well, giving businesses a good idea of when the government will challenge mergers. Most mergers are rapidly approved; the remainder often require only minor adjustments or more information to satisfy government agencies. In the end, only a few proposed mergers are seriously challenged.
Contestable Markets
contestable markets Markets that look monopolistic, but where entry costs are low the sheer threat of entry keeps prices low.
Sometimes what looks like a monopolist does not act like a monopolist. Markets that are contestable fit this description. Contestable markets are those markets with entry costs low enough that the sheer threat of entry keeps prices low. Potential competition constrains firm behavior. For example, Microsoft might charge more for its latest version of Windows if Linux were not nipping at its heels. Similarly, the Around the World from earlier in this chapter showed how ABC stores in Hawaii keep prices low due to the threat of market entry.
Another common example of a contestable market is the airline industry. Small regional carriers often fly unique routes from small airports to major tourist destinations such as Las Vegas and several spots in Florida. Although many of these routes are unique (in that only one airline serves the route), airlines tend to keep fares reasonable rather than exploit their market power for that route. Airlines realize that if fares are priced at the monopoly level, another airline might enter and compete. The ability to change airline service routes quickly forces airlines to keep prices at a competitive level, even if they are the only airline providing service between two cities.
The Future of Antitrust Policy
Today’s economy differs from the old economy in many ways. The old economy was grounded in manufacturing and selling physical goods such as steel, automobiles, appliances, and shoes, which involved significant production and distribution costs. Much of the new economy involves intellectual property, or the use of innovation to provide valuable services such as mobile apps, streaming services, and online education. When distribution costs for services are nearly zero, monopolies can be vulnerable when new ideas are created.
Antitrust laws and policy therefore need to be adjusted to new market realities. Rather than regulate traditional natural monopolies such as electricity or taxi services, opening these services to competition is seen as a more efficient solution that reduces the need for bureaucratic rules. One federal judge and economist, Richard Posner, argues that all antitrust laws should be repealed and replaced with a simple statute that prohibits “unreasonably anti-
2Richard A. Posner, Antitrust Law, 2nd ed. (Chicago: University of Chicago Press), 2001, p. 260.
This and the last chapter looked at the polar opposite market structures, competition and monopoly, with the characteristics of each shown in Table 3. The next chapter examines the market structures in the middle and also a more modern approach to analyzing firm behavior, game theory.
| TABLE 3 | COMPARISON BETWEEN PERFECT COMPETITION AND MONOPOLY | ||||||
| Perfectly competitive firms and monopoly firms differ in the number of firms in the industry, the ability to set prices, the barriers to enter the industry, the ability to earn long- |
|||||||
| Perfect Competition | Monopoly | ||||||
| Many firms | One firm | ||||||
| Price taking | Price making | ||||||
| No barriers to entry | Significant barriers to entry | ||||||
| Marginal Revenue = Price | Marginal Revenue < Price | ||||||
| Zero economic profit in the long run | Potential economic profits in the long run | ||||||
| No deadweight loss (efficiency) | Deadweight loss (inefficiency) | ||||||
CHECKPOINT
REGULATION AND ANTITRUST
Regulating monopolies may involve a marginal cost pricing rule (have the monopolist set price equal to marginal cost) or an average cost pricing rule (have the monopolist set price equal to average total cost).
In practice, regulation often involves setting an acceptable rate of return on capital or setting price caps on charges.
The Sherman Act (1890), Clayton Act (1914), and Federal Trade Commission Act (1914) each prohibited various forms of business practices that inhibit competition.
Concentration ratios measure market concentration by looking at the share of industry sales accounted for by the top n firms.
The Herfindahl–
Hirschman index (HHI) measures concentration by computing the sum of the squares of market shares for all firms in the industry. The Department of Justice uses the HHI to set premerger guidelines.
Contestable markets are markets with entry costs so low that the potential threat of entry keeps prices low.
QUESTION: In September 2011 AT&T attempted to buy one of its major competitors, T-
Answers to the Checkpoint questions can be found at the end of this chapter.
The government aims to prevent powerful monopolies, which can restrict competition and lead to fewer choices and higher prices, from forming. The Sherman Antitrust Act of 1890 and the Clayton Act of 1914 provide the legal basis for such action. The government uses concentration ratios or the HHI as a gauge to determine whether a pending merger would harm competition. If each of four firms controls 25% of the market, the HHI is 2,500, already a very concentrated industry. By allowing AT&T and T-