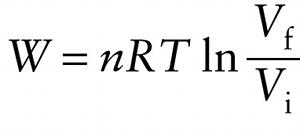
Work done by an ideal gas in an isothermal (constant-temperature) process (15-6)
Question 1 of 6
Question
Ideal gas constant
{"title":"Number of moles of gas","description":"Wrong","type":"incorrect","color":"#99CCFF","code":"[{\"shape\":\"poly\",\"coords\":\"82,133\"},{\"shape\":\"rect\",\"coords\":\"10,16,12,16\"},{\"shape\":\"rect\",\"coords\":\"96,48,128,75\"}]"} {"title":"Ideal gas constant","description":"Correct!","type":"correct","color":"#ffcc00","code":"[{\"shape\":\"rect\",\"coords\":\"124,35,157,75\"}]"} {"title":"Volume of the gas at the end of the process","description":"Incorrect","type":"incorrect","color":"#333300","code":"[{\"shape\":\"rect\",\"coords\":\"250,0,298,55\"}]"} {"title":"Volume of the gas at the beginning of the process","description":"Incorrect","type":"incorrect","color":"#000080","code":"[{\"shape\":\"rect\",\"coords\":\"251,65,298,116\"}]"} {"title":"Kelvin temperature of the gas","description":"Wrong","type":"incorrect","color":"#333333","code":"[{\"shape\":\"rect\",\"coords\":\"158,35,193,75\"}]"} {"title":"Work that an ideal gas does in an isothermal process","description":"Incorrect","type":"incorrect","color":"#800000","code":"[{\"shape\":\"rect\",\"coords\":\"5,35,54,75\"}]"}Review
On a pV diagram, the area under the curve represents the work W done by the gas; Figure 15-7b shows this area for an isothermal expansion. Unlike the isobaric case shown in Figure 15-6, the area under the curve is not a rectangle, so we cannot find W simply by multiplying the pressure and the change in volume. Using calculus, it can be shown that the work that the gas does as the volume changes is

