2.3 The Correlational Method
Correlation is the degree to which events or characteristics vary with each other. The correlational method is a research procedure used to determine this “co-
 correlation The degree to which events or characteristics vary along with each other.
correlational method A research procedure used to determine how much events or characteristics vary along with each other.
BETWEEN THE LINES
In Their Words
“The temptation to form premature theories upon insufficient data is the bane of our profession.”
Sherlock Holmes in The Valley of Fear, 1914
To test this particular question, researchers have collected life stress scores (for example, the number of threatening events experienced during a certain period of time) and depression scores (for example, scores on a depression survey) from individuals and have correlated these scores. The people who are chosen for a study are its subjects, or participants, the term preferred by today’s investigators. The participants in a given study are collectively called its sample. A sample must be representative of the larger population that the researchers wish to understand. Otherwise the relationship found in the study may not apply elsewhere in the real world—
Describing a Correlation
Suppose you were to use the correlational method to conduct a study of depression. You would collect life stress scores and depression scores for 10 people and plot the scores on a graph, as shown in Figure 2-1. As you can see, the participant named Jim has a recent life stress score of 7, meaning seven threatening events over the past 3 months; he also has a depression score of 25. Thus he is “located” at the point on the graph where these two scores meet. The graph provides a visual representation of your data. Here, notice that the data points all fall roughly along a straight line that slopes upward. You would draw the line so that the data points are as close to it as possible. This line is called the line of best fit.
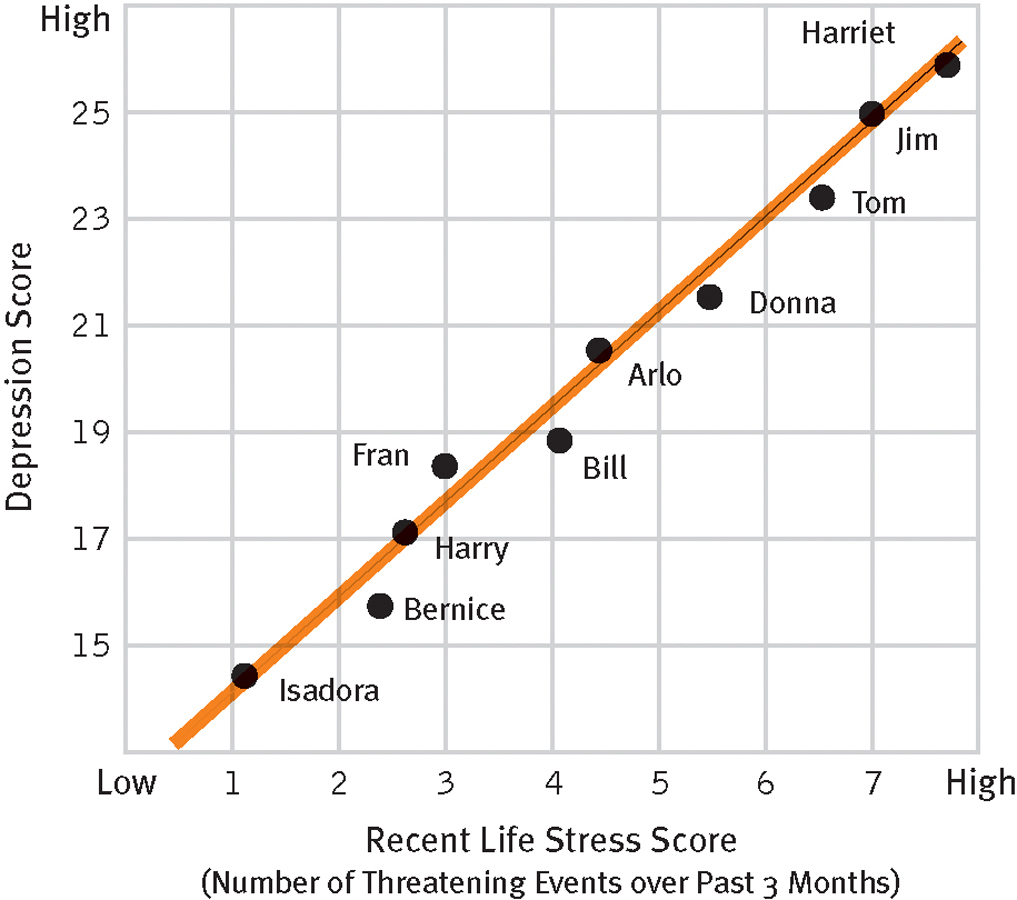
Positive correlation
The relationship between amount of recent stress and feelings of depression shown by this hypothetical sample of 10 participants is a near-
The line of best fit in Figure 2-1 slopes upward and to the right, indicating that the variables under examination are increasing or decreasing together. That is, the greater someone’s life stress score, the higher his or her score on the depression scale. When variables change the same way, their correlation is said to have a positive direction and is referred to as a positive correlation. Most studies of life stress and depression have indeed found a positive correlation between those two variables (Monroe et al., 2014; Slavich & Irwin, 2014).
Correlations can have a negative rather than a positive direction. In a negative correlation, the value of one variable increases as the value of the other variable decreases. Researchers have found, for example, a negative correlation between depression and activity level. The greater one’s depression, the lower the number of one’s activities. When the scores of a negative correlation are plotted, they produce a downward-
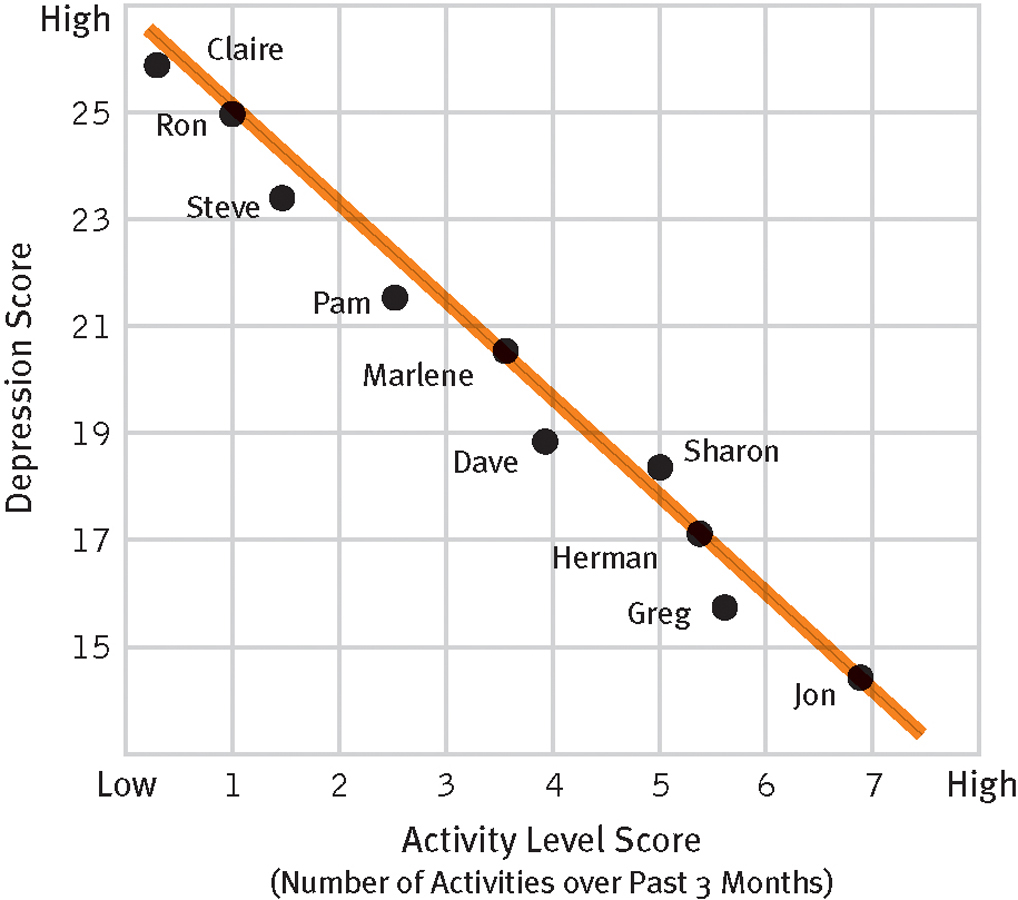
Negative correlation
The relationship between number of activities and feelings of depression shown by this hypothetical sample is a near-
There is yet a third possible outcome for a correlational study. The variables under study may be unrelated, meaning that there is no consistent relationship between them. As the measures of one variable increase, those of the other variable sometimes increase and sometimes decrease. The graph of this outcome looks like Figure 2-3. Here the line of best fit is horizontal, with no slope at all. Studies have found that depression and intelligence are unrelated, for example.
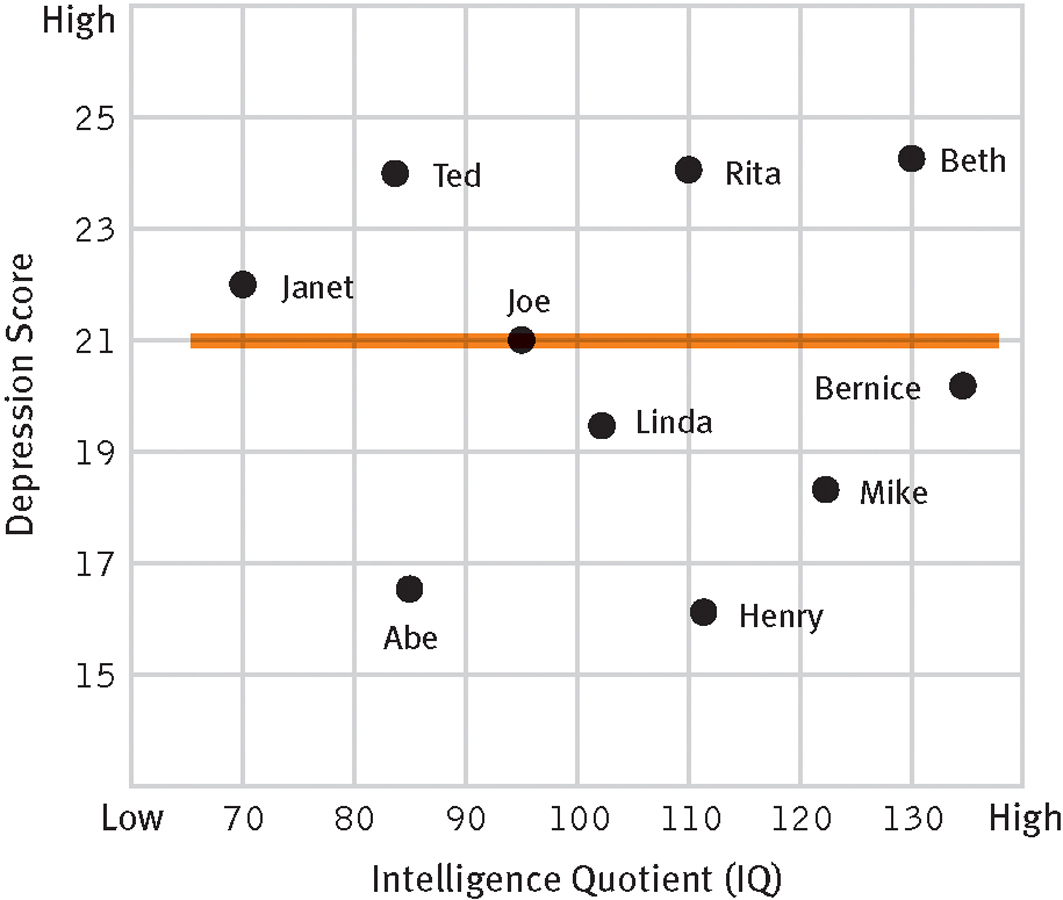
No correlation
The relationship between intelligence and feelings of depression shown by this hypothetical sample is a “near-
In addition to knowing the direction of a correlation, researchers need to know its magnitude, or strength (see Figure 2-4). That is, how closely do the two variables correspond? Does one always vary along with the other, or is their relationship less exact? When two variables are found to vary together very closely in person after person, the correlation is said to be high, or strong.
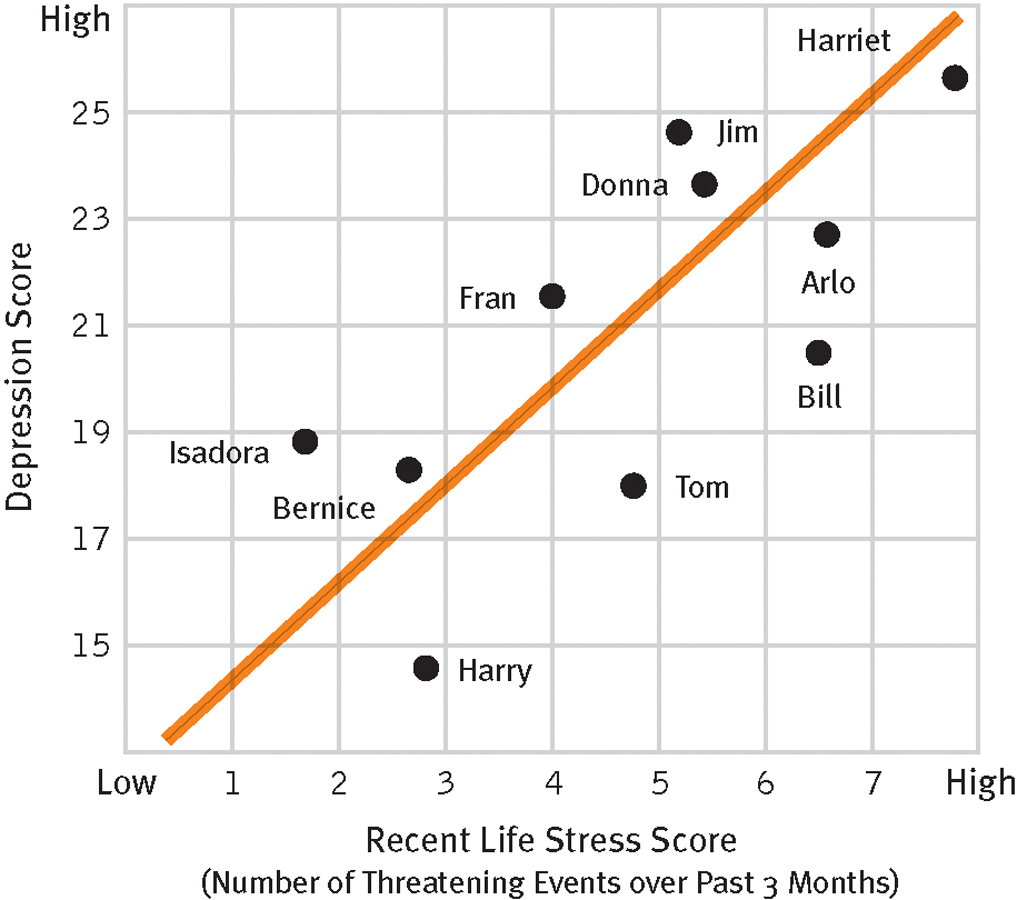
Magnitude of correlation
The relationship between amount of recent stress and feelings of depression shown by this hypothetical sample is a “moderately positive” correlation.
BETWEEN THE LINES
Psychological Disorders Linked to Life Stress
Depression
Anxiety disorders
Eating disorders
Posttraumatic stress disorder
Schizophrenia
Substance abuse
Dissociative disorder
Sleep disorders
Sexual dysfunction
Suicide
(Monroe et al., 2013; Slavich & Irvin, 2014; Hollander & Simeon, 2011; Bernert et al., 2007; Hartley et al., 2007)
Look again at Figure 2-1. In this graph of a positive correlation between depression and life stress, the data points all fall very close to the line of best fit. Researchers can predict each person’s score on one variable with a high degree of confidence if they know his or her score on the other. But what if the graph of the correlation between depression and life stress looked more like Figure 2-4? In this figure the data points are loosely scattered around the line of best fit rather than hugging it closely. In this case, researchers could not predict with as much accuracy an individual’s score on one variable from his or her score on the other variable. The correlation in Figure 2-1 is stronger, or greater in magnitude, than that in Figure 2-4.
The direction and magnitude of a correlation are often calculated numerically and expressed by a statistical term called the correlation coefficient, symbolized by the letter r. The correlation coefficient can vary from +1.00, which indicates a perfect positive correlation between two variables, down to –1.00, which represents a perfect negative correlation. The sign of the coefficient (+ or −) signifies the direction of the correlation; the number represents its magnitude. An r of .00 reflects a zero correlation, or no relationship between variables. The closer r is to .00, the weaker, or lower in magnitude, the correlation. Thus correlations of +.75 and –.75 are of equal magnitude and equally strong, whereas a correlation of +.25 is weaker than either.
Everyone’s behavior is changeable, and many human responses can be measured only approximately. Most correlations found in psychological research, therefore, fall short of perfect positive or negative correlation. For example, one early study of life stress and depression, with a sample of 68 adults, found a correlation of +.53 (Miller, Ingham, & Davidson, 1976). Although hardly perfect, a correlation of this magnitude is considered large in psychological research.

When Can Correlations Be Trusted?
Scientists must decide whether the correlation they find in a given sample of participants accurately reflects a real correlation in the general population. Could the observed correlation have occurred by mere chance? Scientists can never know for certain, but they can test their conclusions with a statistical analysis of their data, using principles of probability. In essence, they ask how likely it is that the study’s particular findings have occurred by chance. If the statistical analysis indicates that chance is unlikely to account for the correlation they found, researchers may conclude that their findings reflect a real correlation in the general population.
A cutoff point helps researchers make this decision. By convention, if there is less than a 5 percent probability that a study’s findings are due to chance (signified as p < .05), the findings are said to be statistically significant and are thought to reflect the larger population. In the life stress study described earlier, a statistical analysis indicated a probability of less than 5 percent that the +.53 correlation found in the sample was due to chance. Therefore, the researchers concluded with some confidence that among adults in general, depression does tend to rise along with the amount of recent stress in a person’s life. Generally, our confidence increases with the magnitude of the correlation and the size of the sample. The larger they each are, the more likely it is that a correlation will be statistically significant.
What Are the Merits of the Correlational Method?
BETWEEN THE LINES
In Their Words
“Life is the art of drawing sufficient conclusions from insufficient premises.”
Samuel Butler
The correlational method has certain advantages over the case study (see Table 2-1). First, it possesses high external validity. Because researchers measure their variables, observe large samples, and apply statistical analyses, they are in a better position to generalize their correlations to people beyond the ones they have studied. Furthermore, researchers can easily repeat correlational studies using new samples of participants to check the results of earlier studies.
|
|
Provides Individual Information |
Provides General Information (External Validity) |
Provides Causal Information (Internal Validity) |
Statistical Analysis Possible |
Replicable |
|---|---|---|---|---|---|
|
Case study |
Yes |
No |
No |
No |
No |
|
Correlational method |
No |
Yes |
No |
Yes |
Yes |
|
Experimental method |
No |
Yes |
Yes |
Yes |
Yes |
Can you think of other correlations in life that are interpreted mistakenly as causal?
On the other hand, correlational studies, like case studies, lack internal validity (Jackson, 2012; Remler & Van Ryzin, 2011). Although correlations allow researchers to describe the relationship between two variables, they do not explain the relationship. When we look at the positive correlation found in many life stress studies, we may be tempted to conclude that increases in recent life stress cause people to feel more depressed. In fact, however, the two variables may be correlated for any one of three reasons: (1) Life stress may cause depression. (2) Depression may cause people to experience more life stress (for example, a depressive approach to life may cause people to perform poorly at work or may interfere with social relationships). (3) Depression and life stress may each be caused by a third variable, such as financial problems (Gutman & Nemeroff, 2011).
Although correlations say nothing about causation, they can still be of great use to clinicians. Clinicians know, for example, that suicide attempts increase as people become more depressed. Thus, when they work with severely depressed clients, they stay on the lookout for signs of suicidal thinking. Perhaps depression directly causes suicidal behavior, or perhaps a third variable, such as a sense of hopelessness, causes both depression and suicidal thoughts. Whatever the cause, just knowing that there is a correlation may enable clinicians to take measures (such as hospitalization) to help save lives.
Of course, in other instances, clinicians do need to know whether one variable causes another. Do parents’ marital conflicts cause their children to be more anxious? Does job dissatisfaction lead to feelings of depression? Will a given treatment help people to cope more effectively in life? Questions about causality call for the experimental method, as you will see later.
Special Forms of Correlational Research
Epidemiological studies and longitudinal studies are two kinds of correlational research used widely by clinical investigators. Epidemiological studies reveal the incidence and prevalence of a disorder in a particular population (Kasl & Jones, 2011). Incidence is the number of new cases that emerge during a given period of time. Prevalence is the total number of cases in the population during a given period; prevalence includes both existing and new cases. Many researchers also refer to epidemiological studies as “descriptive studies” because the goal of such investigations is largely to describe the incidence or prevalence of a disorder “without trying to predict or explain when or why it occurs” (Compas & Gotlib, 2002, p. 69).
epidemiological study A study that measures the incidence and prevalence of a disorder in a given population.
incidence The number of new cases of a disorder occurring in a population over a specific period of time.
prevalence The total number of cases of a disorder occurring in a population over a specific period of time.
Over the past 40 years, clinical researchers throughout the United States have worked on one of the largest epidemiological studies of mental disorders ever conducted, called the Epidemiologic Catchment Area Study (Ramsey et al., 2013; Maulik et al., 2010). They have interviewed more than 20,000 people in five cities to determine the prevalence of many psychological disorders and the treatment programs used. Two other large-
Such epidemiological studies have helped researchers identify groups at risk for particular disorders. Women, it turns out, have a higher rate of anxiety disorders and depression than men, while men have a higher rate of alcoholism than women. Elderly people have a higher rate of suicide than young people. Hispanic Americans experience posttraumatic stress disorder more than other racial and ethnic groups in the United States. And persons in some countries have higher rates of certain mental disorders than those in other countries. Eating disorders such as anorexia nervosa, for example, appear to be more common in Western countries than in non-

In longitudinal studies (also called high-
longitudinal study A study that observes the same participants on many occasions over a long period of time.