Maps
Maps provide information about a particular geographic area, such as a city, state, province, or country. The state highway maps sold at gas stations provide detailed information about the highways in a particular state, including mile markers, freeway exit ramps, rest areas, and information about tolls. The maps available at national park entrance gates typically provide information about roads, campsites, wildlife viewing areas, and various facilities within the park. The maps available through Web sites such as Google Maps (maps.google.com) and MapQuest (mapquest.com) can be customized for individual readers, providing not only directions from one location to another, but also information about what might be found at any point along the route. The digital map services can also allow readers to view the map in various ways, ranging from a traditional view of roads and municipalities to satellite imagery and, in the case of Google Maps, a street view that changes depending on where you are “looking.” Some maps, such as the World DataBank maps featured here, can also be viewed dynamically, allowing interaction between an underlying database and the display of the map.
With growing frequency, maps can be developed to respond to the particular needs of groups of readers. Maps can show the location and severity of droughts, the migration of animal populations, the production of crops in particular areas, and the distribution of particular demographic features across a population, such as literacy rates, incomes, and voting patterns. The biases of map developers are typically not visible to readers, but they are nonetheless important. The design of a particular map or mapping Web site will direct readers’ attention to particular issues while obscuring or ignoring others. Experienced readers, as a result, will ask not only what the map allows you to see but also what cannot be shown.
 | The World Bank |
World DataBank |
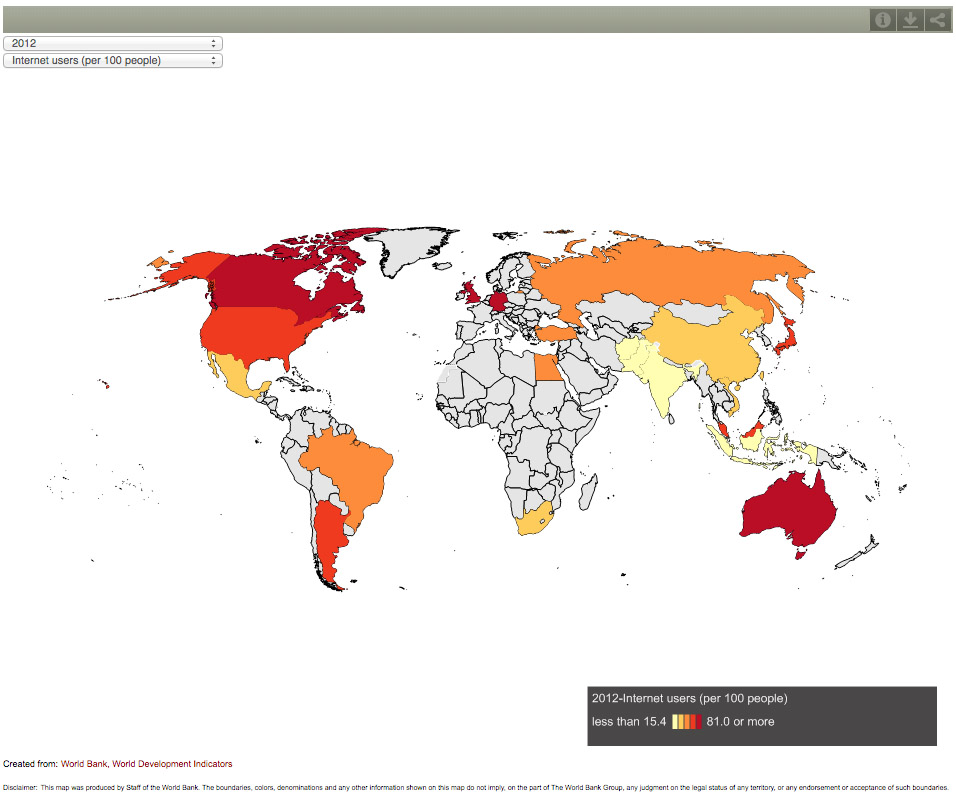
The World Bank is a non-governmental organization dedicated to reducing poverty and increasing prosperity around the world. Comprised of five institutions, it focuses on global development and lends money and provides grants to developing countries. In addition, the World Bank gathers data from individual countries on a variety of economic, social, and environmental factors. These factors, called development indicators, may be used to understand how a country is developing. The maps here show 20 development indicators, such as carbon dioxide emissions, number of Internet users per 100 people, life expectancy, and consumer price inflation, during the years 2000–2012. By mapping such data for all countries, the World DataBank provides a snapshot in time of how global development is taking shape.
(Click on the image below to enlarge the map.)
| Starting a Conversation: Respond to “World DataBank” | |
 | In the text boxes below, consider how this interactive map presents information by responding to the following questions: |
Question
Question
Question
Question