Figure 12.30
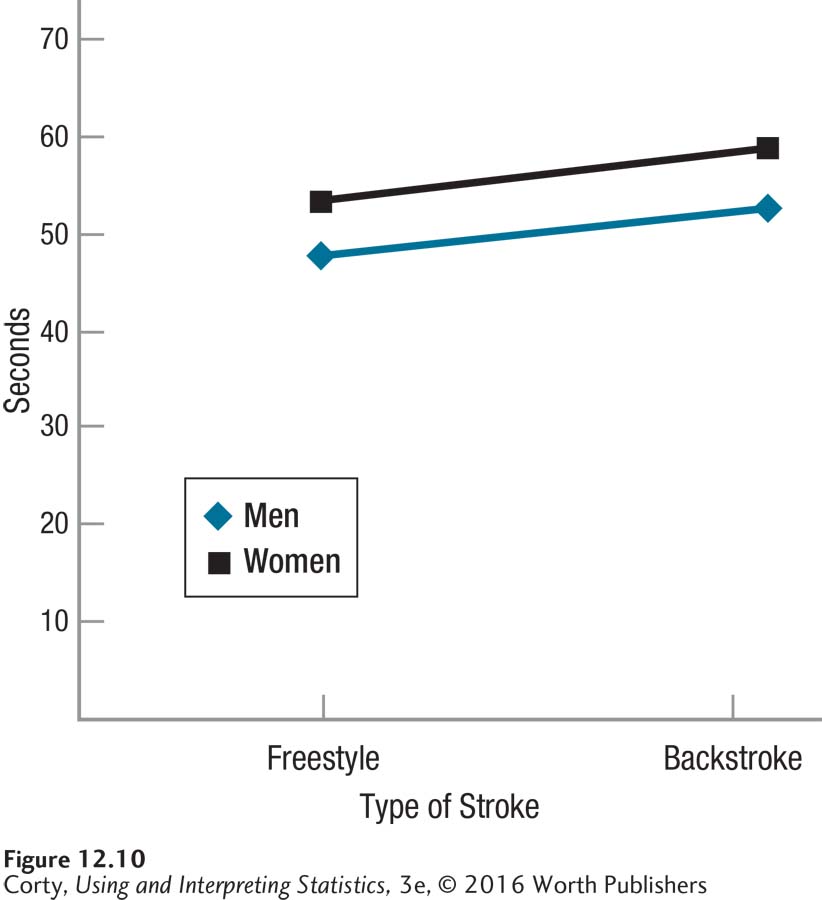
Figure 12.10
2012 Summer Olympics: Average Times of Top 5 Finishers
This figure shows the effects of sex and stroke on how long it takes to swim 100 yards.