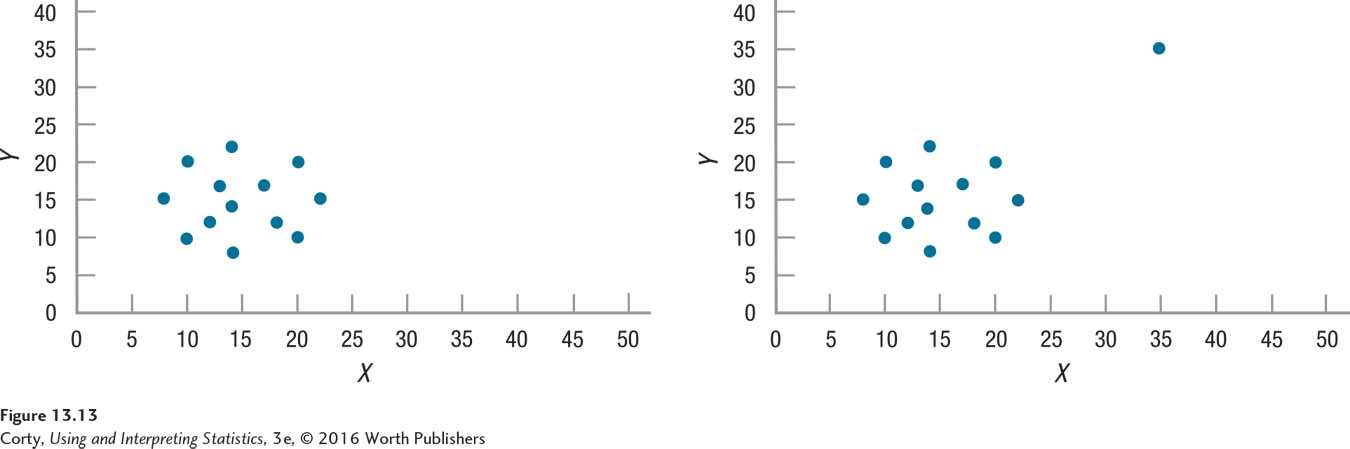
Figure 13.15 Figure 13.13 Effect of an Outlier on a Pearson Correlation The correlation in the left scatterplot is zero. In the right scatterplot, the correlation is .63 thanks to the addition of one case. The additional case is an outlier, with extreme values on X and Y.