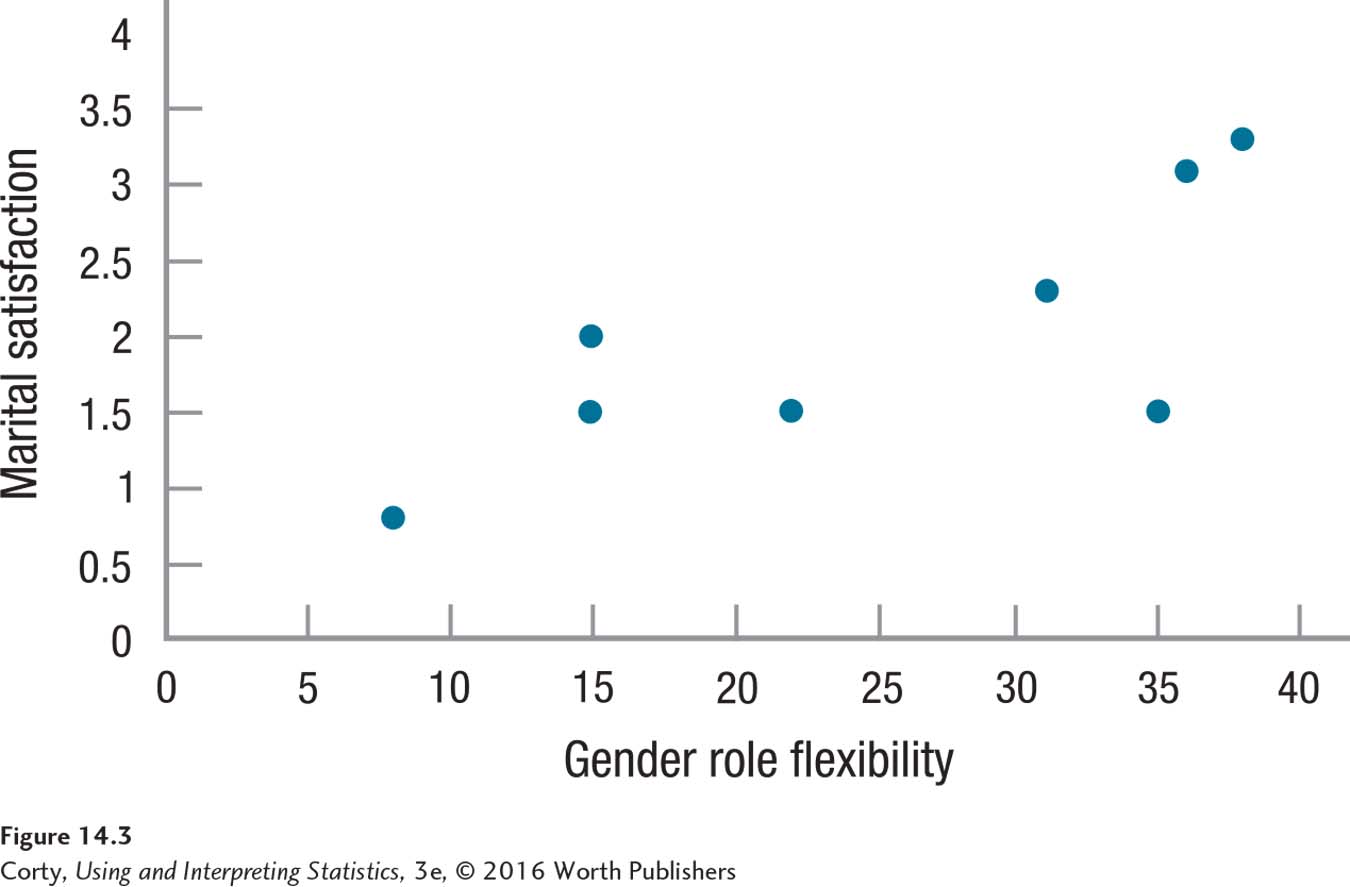
Figure 14.3 Figure 14.3 Relationship Between Gender Role Flexibility and Marital Satisfaction Though there is a strong (r = .76) relationship between the two variables in this scatterplot, it is not clear where the best place is to draw a regression line for predicting Y from X.