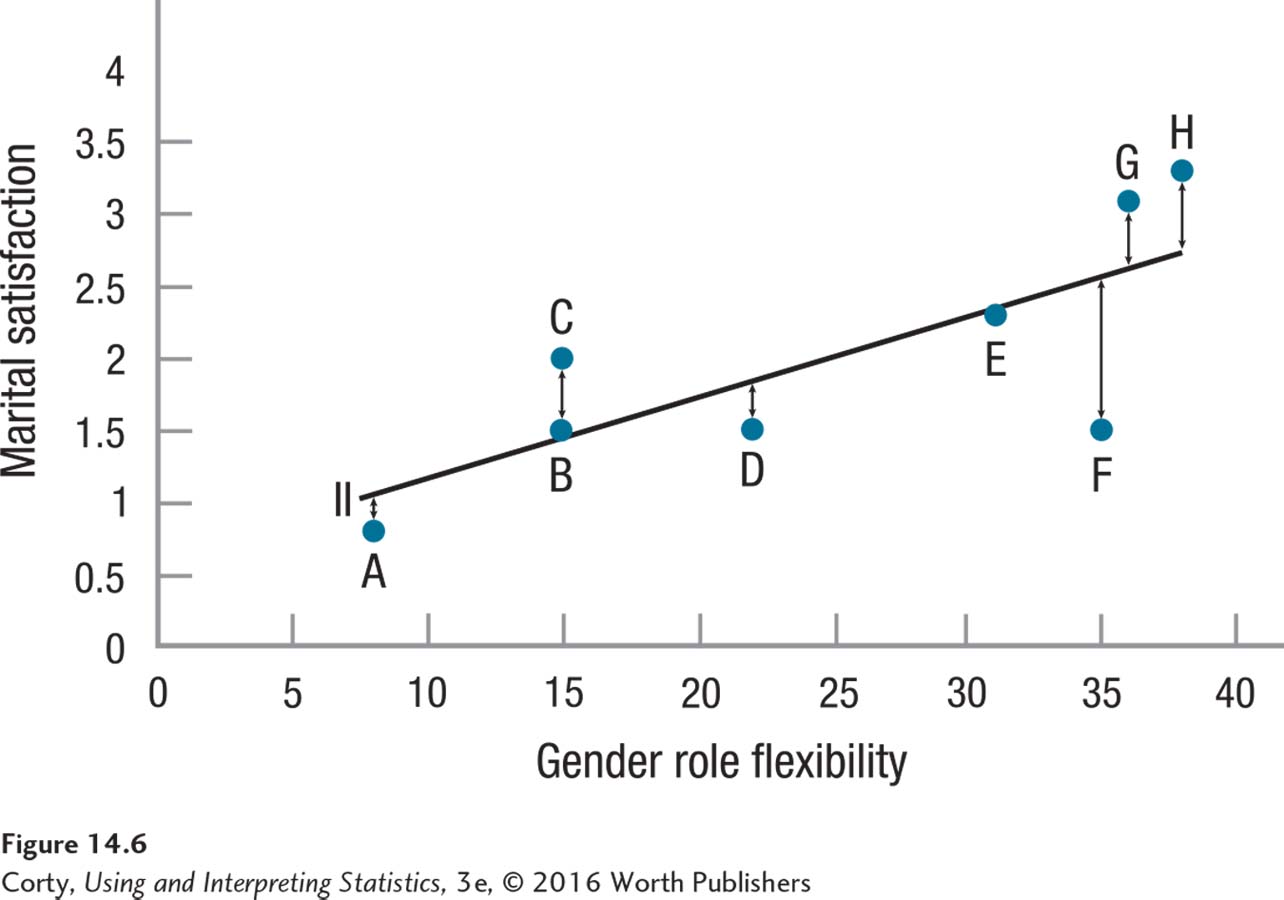
Figure 14.6 Figure 14.6 Errors in Prediction This figure compares the cases’ actual marital satisfaction scores to their predicted scores for line II from Figure 14.4. The double-headed arrows from the actual cases to the line show the sizes of the errors. Notice that for some cases (e.g., A, B, and E), the errors are small and the predicted values are close to the actual values. For other cases, like F, the error is large and the predicted value is far from the actual value.