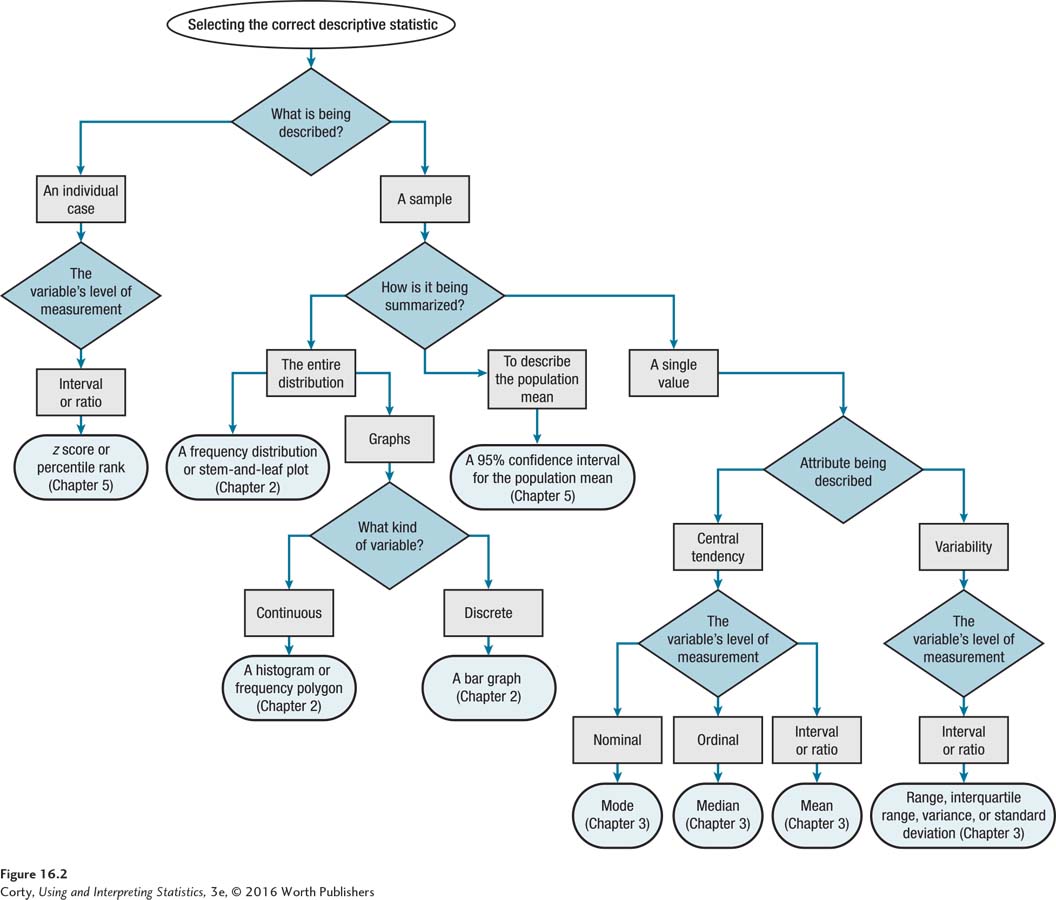
Figure 16.3 Figure 16.2 How to Choose: Selecting a Descriptive Statistic This flowchart is used to select the correct descriptive statistic, depending on (1) whether one is trying to describe an individual case, a sample, or a population; (2) what attribute one wants to describe (central tendency or variability); and (3) the variable’s level of measurement (nominal, ordinal, interval, or ratio).