Figure 2.19
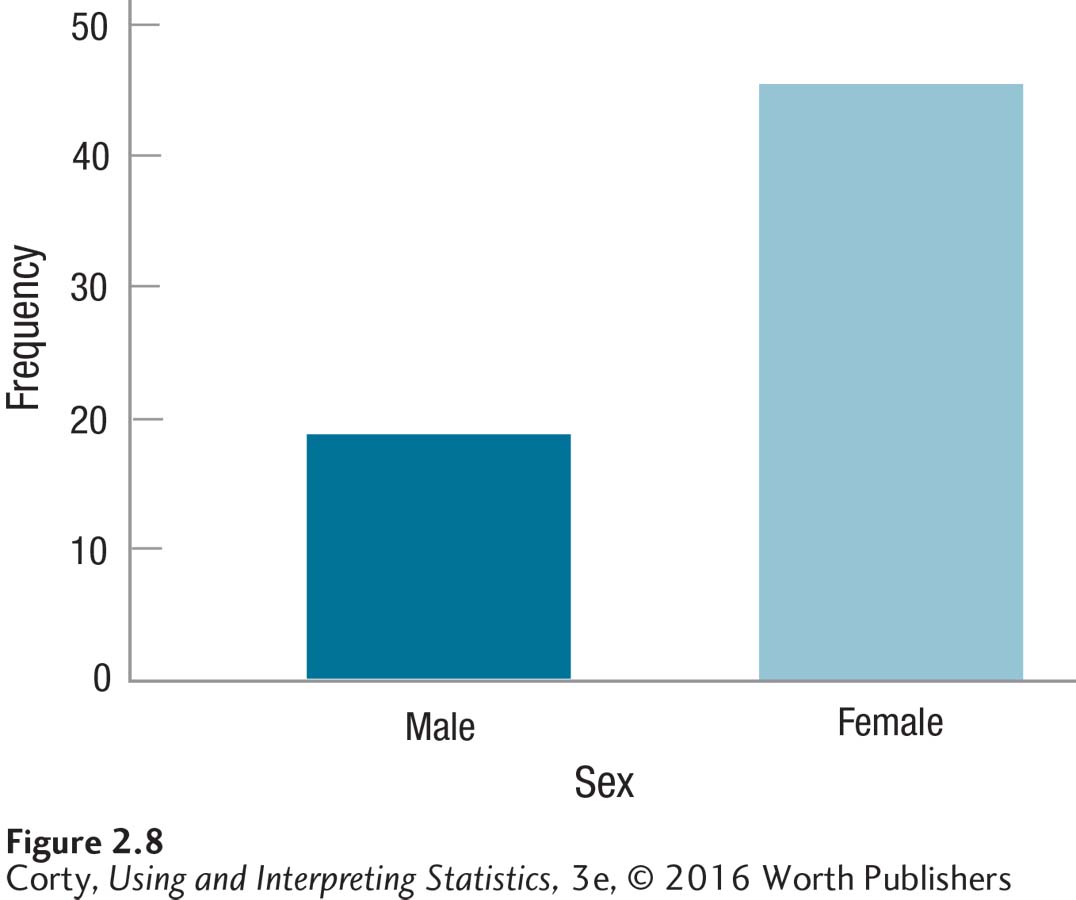
Figure 2.8
Bar Graph Showing the Sex of Students (
N
= 65) in Upper-Level Psychology Class
Note that the bars don’t touch each other in bar graphs because the variable on the
X
-axis is discrete.