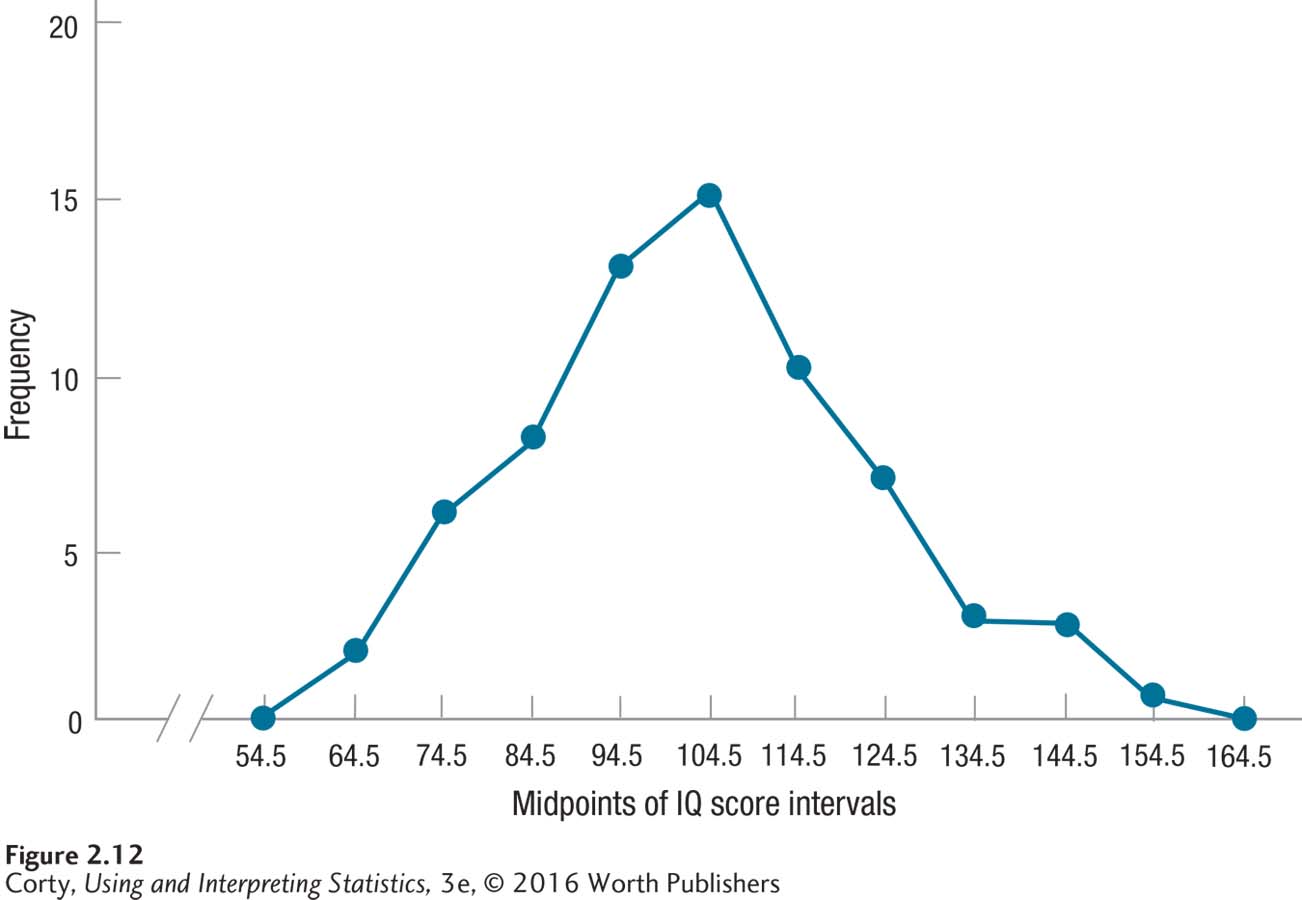
Figure 2.23 Figure 2.12 Frequency Polygon Showing Grouped Frequency Distribution of IQ Scores for 68 Sixth Graders (Interval Width = 10) Frequency polygons are made for continuous variables. The frequencies are marked by dots at the appropriate height at the midpoints of the intervals. Then the dots are connected by lines. Note that the graph starts and ends at intervals with a frequency of zero.