Figure 2.25
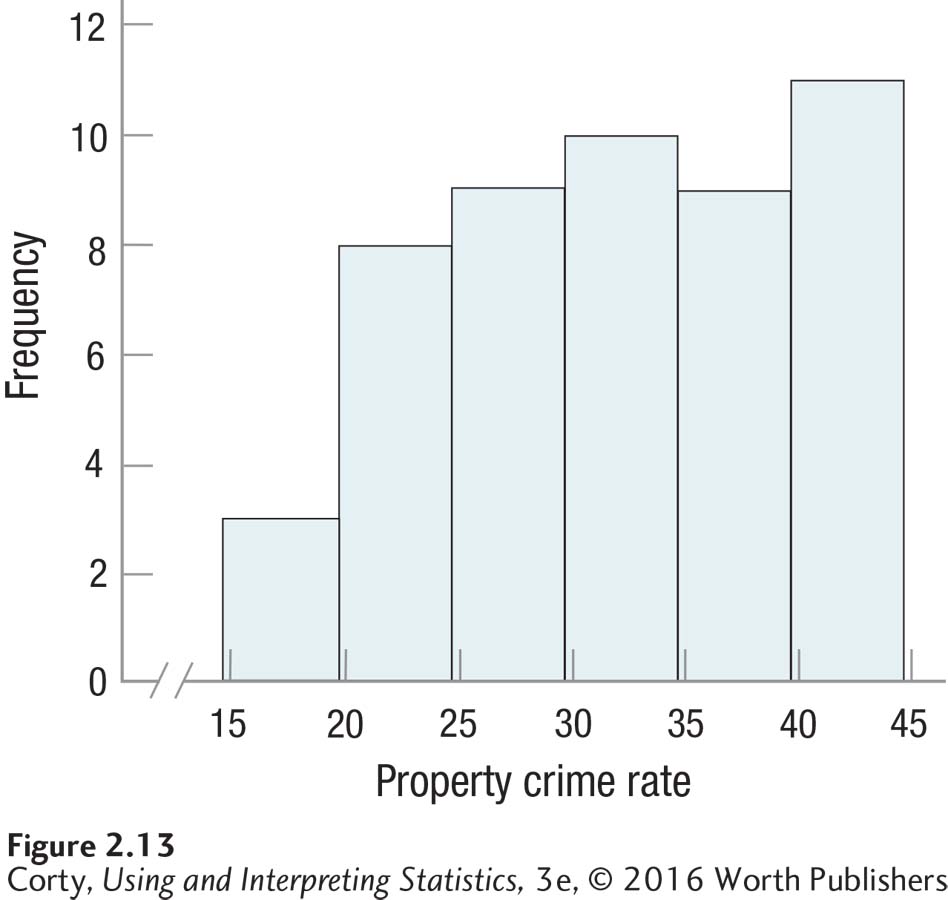
Figure 2.13
Histogram Showing Property Crime Rates per 1,000 Population for the 50 States
This frequency distribution, which is for a continuous variable, could also be graphed as a frequency polygon.