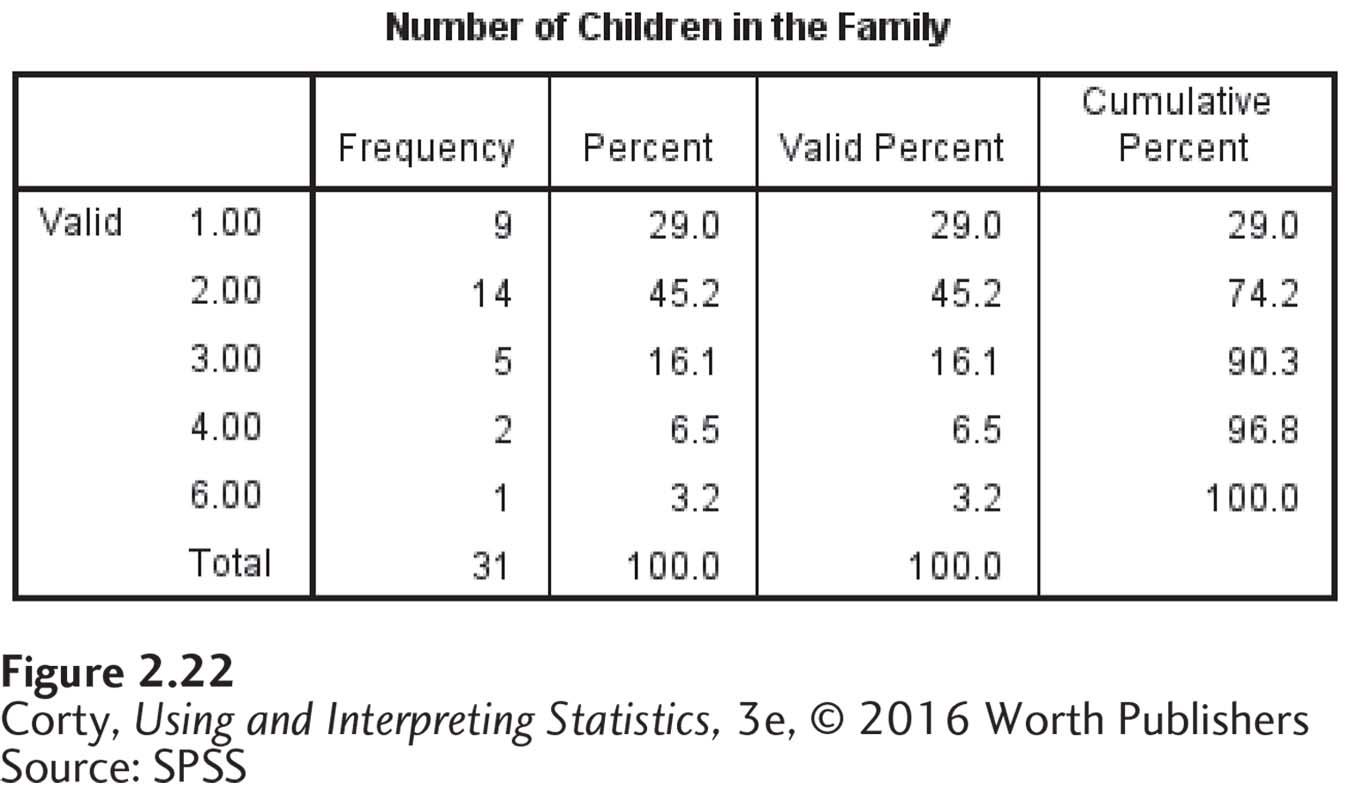
Figure 2.41 Figure 2.22 Example of Frequencies Output from SPSS Compare this SPSS output to Table 2.3, for the same data. Note that Table 2.3 was arranged upside down, compared to SPSS. Table 2.3 also contained additional information—cumulative frequency. Finally, Table 2.3 included values, such as five children in the family, for which the frequency was zero.